Technical Questions
Can I override the status of a KPI?
Yes, it's possible to use a manual override or a dynamic override based on a condition or a value in a data source.
How Do I Set an Asset Status to 'Not in Service' and Stop Alerts?
The best way to stop false alerts in Visual KPI when you have a piece of equipment that's OFF is to set the status to Not in Service.
Can I share, open or link to a specific dashboard, regardless of what profile is currently selected?
Yes, and you have multiple options for linking to dashboards:
- Create several dashboards in the same profile and use the pulldown menu to choose the one you want to view.
- Add a link via Customize Dashboard.
- Pin a link to the Bookmark Bar.
To learn more about each of these options to Customize Your Visual KPI Dashboard, refer to the Dashboard page of the Basic Navigation guide.
How to share or link to a specific Dashboard?
Sometimes you need to quickly share a specific dashboard with a colleague or create a link to a dashboard for the bookmark bar or another dashboard. For most objects in Visual KPI, the URL address in your browser will work, but dashboards are a bit different:
- Dashboards have a specific URL in your browser that looks something like this: http://demo.transpara.com/tandd/?pid=0, where “?pid-0” means “the dashboard” but not a specific dashboard. This is because Visual KPI remembers what dashboard the user was last using, or goes to the default dashboard if this is the first visit from a browser.
- Because of the above, if you want to share a specific dashboard or get its exact URL you need to use the share button (for users) or get the dashboard ID in the Visual KPI Designer (for admins).
- A specific dashboard link will include the ID and look like this: http://demo.transpara.com/tandd/?pid=0&dashid=de1bfb47-efa3-4f1a-b9f6-eae566317ff1
You can find the URL link to a specific dashboard, KPI, or any page you are viewing via the Share button. If you are an administrator, you can also get the link to a specific dashboard from the GUID in Visual KPI Designer.
Link to a specific dashboard via Share
To link to a specific dashboard via Share, follow the steps below:
- Click the Share button on the Visual KPI navigation bar to get the URL of any page you are viewing.
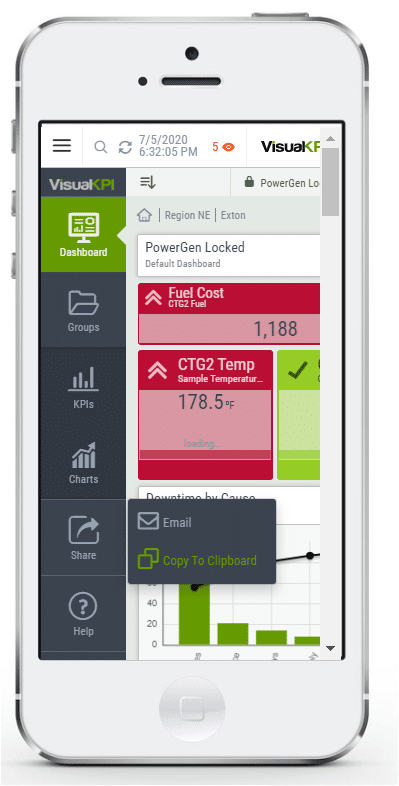
- Use Copy to Clipboard to copy and then paste the dashboard link into any application.
The Email option opens your email account with a pre-populated message that automatically includes the specific URL to the dashboard or page you are currently viewing.

Link to a specific dashboard via Visual KPI Designer
In Visual KPI Designer, you can link to a specific dashboard by doing the following:
- Navigate to the Dashboard or KPI you want to link to.
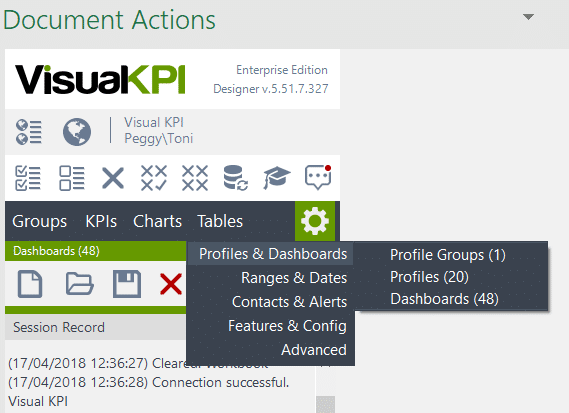
- Find the Dashboard ID.
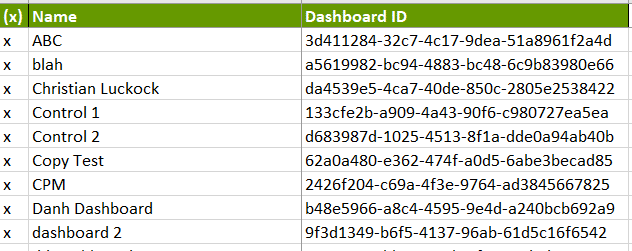
- To link to the Dashboard, use "dashboard: GUID". it will look like this:
dashboard:3d411284-32c7-4c17-9dea-51a8961f2a4d
Learn more
To learn more about this feature, follow the links below:
Can the OLAP Interface be used for data which has both a time and date field in the cube?
Yes, the OLAP interface supports cubes with date only or with date and time dimensions. Since all cubes are different, you will need to write a query that uses the correct dimension names, but the pattern is the same.
Date only Cubes
For cubes with date only, use the following keywords in your queries:
STARTDATEENDDATETIMESTAMP
Cubes with time as dimension
For cubes that include time as a dimension, you'll use the new reserved keyword extensions:
-
StartDate
{STARTDATE}{STARTDATE.Date}{STARTDATE.Time}
-
EndDate
{ENDDATE}{ENDDATE.Date}{ENDDATE.Time}
-
TimeStamp
{TIMESTAMP}{TIMESTAMP.Date}{TIMESTAMP.Time}
If you have existing queries with both Date format and Time format, you will need to modify the trend queries to use {STARTDATE.Date} and {ENDDATE.Date}.
Example Queries
Below are some example queries that incorporate the new keywords. Note the use of the keywords in each example. For this example:
- Input
{0}: KPI Name - Input
{1}: KPI Aggregation Type
Current Value query
The Current Value query requires nothing special as the TAIL function handles it.
SELECT [Measures].[{1}] ON COLUMNS,
{TAIL(NONEMPTY([Date].[Date].Members*
[Time].[Time].[Time].ALLMEMBERS))} ON ROWS
FROM [CubeName]
WHERE ([KPI].[KPI].[{0}], [Time Zone].[Time Zone].[(UTC) Coordinated Universal Time]);
Trend Data Query
The Trend Data query retrieves all data for each day on both ends of the query, then discards the unused portions of the days.
SELECT {[Measures].[{1}]} ON COLUMNS,
NONEMPTY{[Date].[Date].[{STARTDATE.Date}]:[Date].[Date].[{ENDDATE.Date}] *
[Time].[Time].[Time].ALLMEMBERS} ON ROWS
FROM [CubeName]
WHERE ([KPI].[KPI].[{0}], [Time Zone].[Time Zone].[(UTC) Coordinated Universal Time]);
Historical Value Query
The Historical Value query uses the .Time keyword.
SELECT [Measures].[{1}] ON COLUMNS,
TAIL(NONEMPTY([Date].[Date].FirstChild:[Date].[Date].[{TIMESTAMP.Date}] * [Time].[Time].FirstChild:[Time].[Time].[{TIMESTAMP.Time}])) ON ROWS
FROM [CubeName]
WHERE ([KPI].[KPI].[{0}], [Time Zone].[Time Zone].[(UTC) Coordinated Universal Time]);
How OLAP queries work
The table below shows details for how these OLAP queries work. (STARTDATE, ENDATE & TIMESTAMP behave the same way.) Given the following data:
- Input date: 12/25/2016 1:00:00 PM
- Default Date Format: yyyy-MM-dd
- Default Time Format: HH:mm
| Date Format | Time Format | Result for TIMESTAMP | Result for TIMESTAMP.Date | Result for TIMESTAMP.Time |
|---|---|---|---|---|
| NONE | NONE | 2016-12-25 13:00 Note: uses default Date & Time format | 2016-12-25 Note: uses default Date format | 13:00 Note: uses default Time format |
| NONE | HH:mm | 2016-12-25 13:00 Note: uses default Date format & User Defined Time format | 2016-12-25 Note: uses default Date format | 13:00 Note: uses User Defined Time format |
| yyyy-MM-dd | NONE | 2016-12-25 Note: uses default Date format ONLY | 2016-12-25 Note: uses default Date format | INVALID |
| yyyy-MM-dd | HH:mm | 2016-12-25 13:00 Note: uses User Defined Date & Time format | 2016-12-25 Note: uses User Defined Date format | 13:00 Note: uses User Defined Time format |
How do I delete an Interface from Visual KPI Server Manager?
Visual KPI won't allow you to delete an interface when you have associated data. If you're trying to delete an interface via Visual KPI Server Manager, you may get a message that looks like this:
Interface [interface name] is referenced and can't be deleted.
Deleting an interface in Visual KPI requires removing all associated data, including KPIs, Charts, and Trends, before using Visual KPI Server Manager.
Can I hide the Visual KPI navigation menu by default?
You can embed a Visual KPI screen in a browser menu to display only real-time data, hiding other navigation elements and page elements. To do this you need to add the word embed into the URL of the selected Visual KPI screen.
Using the URL below as example:
https://demo.transpara.com/PowerGen?pid=0
Adding embed it would become the following URL:
http://demo.transpara.com/PowerGen/embed?pid=0
Access both links above to see the difference between them.
Why is part of Visual KPI Designer toolbar missing in the Document Actions pane?
Certain combinations of Microsoft Windows, Microsoft Office, and VSTO Runtime may cause the Visual KPI Designer toolbar to disappear from the Document Actions pane.
Here are some possible solutions to fix the issue you're experiencing with Visual KPI Designer. We recommend starting with Solution 1 and after applying each fix, restart your computer and reopen the program. If one solution works, then you're good to go. However, if the issue still persists, then try the next solution.
Solution 1: Optimize Microsoft Excel
To optimize Microsoft Excel, follow these steps:
- Open Microsof Excel.
- Click File > Options.
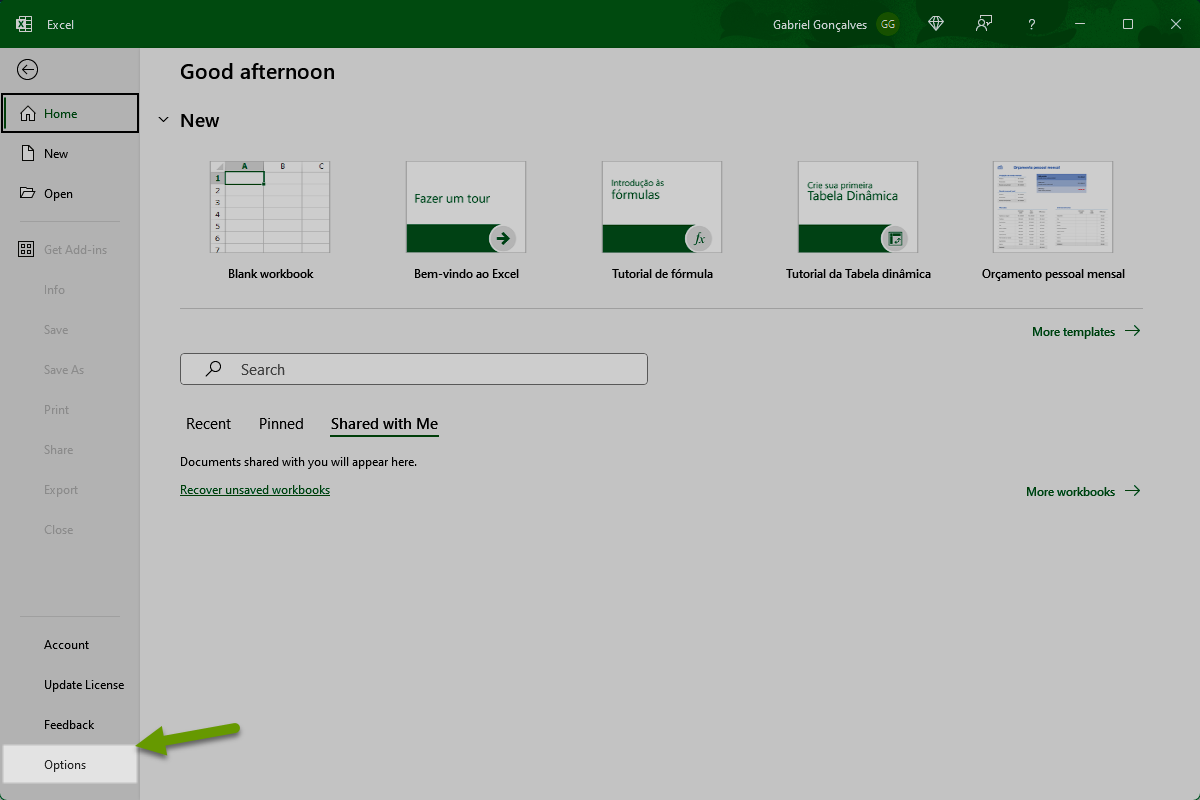
- In the General tab, select the radio button for Optimize for compatibility.
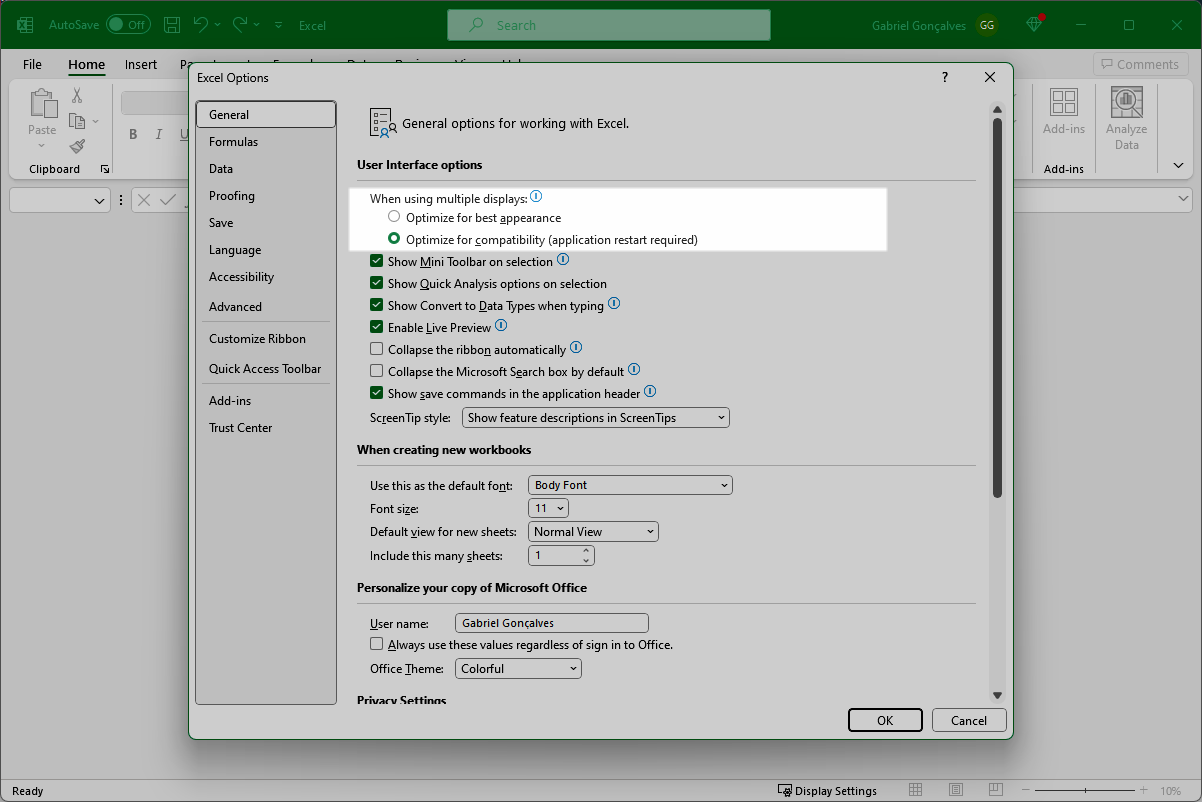
If the radio button isn't visible in the User Interface options, you may have an outdated version of Microsoft Office.
Solution 2: Optimize Windows Display Settings
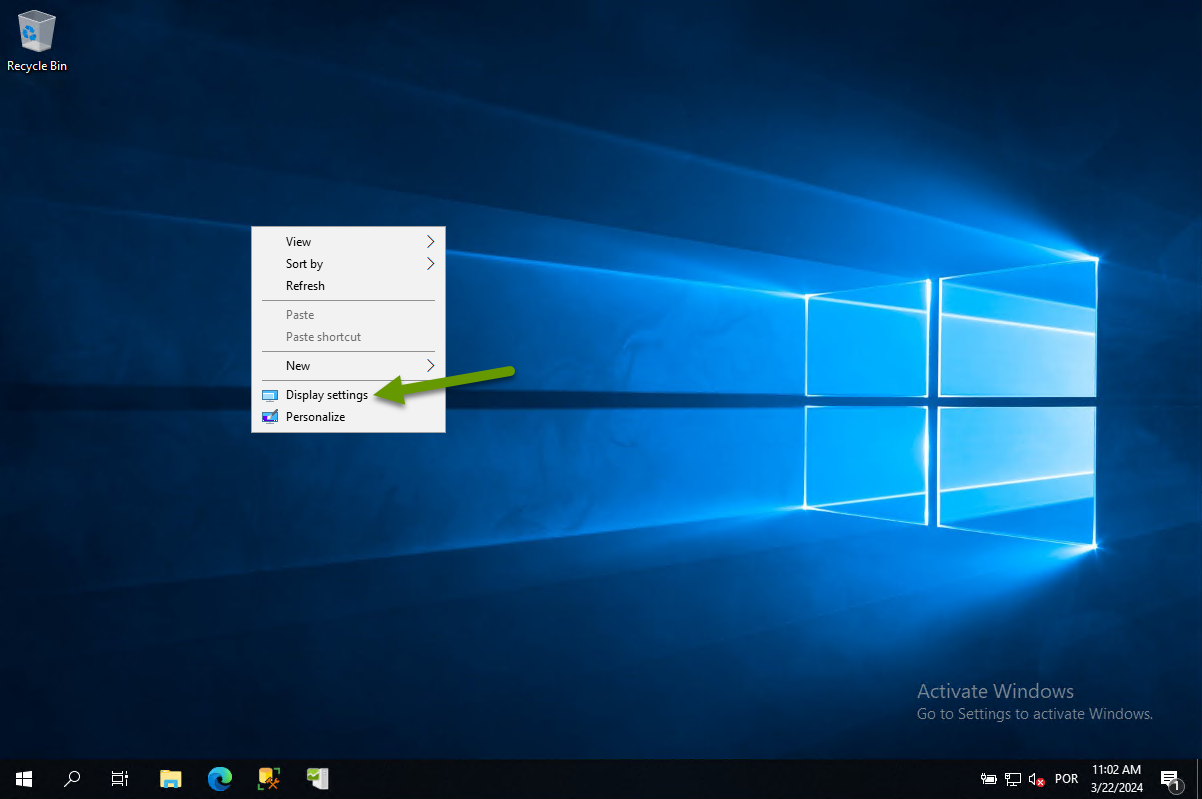
To optimize Microsoft Windows Display Settings, follow these steps:
- In Windows, right-click on the desktop, and select Display Settings.
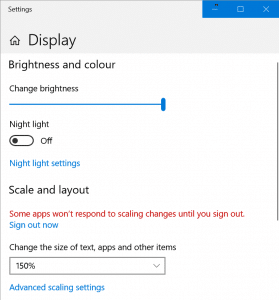
- Change the size of text, apps, and other items from the default (120%) to 150%.
Solution 3: Update to the latest version of Microsoft Office
Once you update Microsoft Office, try restarting your computer. If this resolves the issue, that's great. But you may need to also Optimize Microsoft Excel (Solution 1).
Solution 4: Update to the latest VSTO Runtime
Download the latest version of Visual Studio 2010 Tools for Office Runtime: aka.ms/vstoruntime
For more information on the cause and possible fixes for this issue, refer to this Microsoft support page.
What ports does Visual KPI need to access an interface located behind a firewall?
The default ports are 80 for HTTP and 443 for HTTPS, but you can configure any ports you wish in IIS.
If an interface is separated from its endpoint connection, the port used by the interface must be opened between the Transpara Web server and the data source.
For example, if you're using OSIsoft PI as the data source and there's a firewall between the Transpara Web server and PI server(s), you'll need to open port 5450 to allow inbound traffic to OSI PI coming from our use of the PI or AF SDK.
If you need help with a specific scenario or data source, contact our Support.
Is this a SaaS application or can we host it ourselves (on-premise or our own cloud)?
Transpara isn't a SaaS application, so you are never sending your data to us or relying on us to manage security, privacy, users or your intellectual property. The software can live on-premise or in your own private or public cloud environment, under your control and following your own IT and security policies. It's cloud-friendly (containers, scale-out, etc) but equally at home on servers or virtual machines inside your own local environments or data centers.
Is Transpara just a data visualization application?
No. While Transpara is well-known for its visualization capabilities and user experience, it's an entire operational intelligence, monitoring, alerting, and analytics platform that includes interfaces to thousands of sources (read and/or extract), a high-scale contextual layer with limitless attributes and templates (knowledge graph), an advanced high-scale advanced analytics engine, a powerful time-series data store and more. It can even be used with other visualization software (even though we're quite proud of ours).
Is the view actually real-time, and is that sustainable at scale?
The view is technically “near real-time” which means the visualizations on the screen update automatically in just seconds when data changes, and moving around in time or drilling in for more detail doesn't slow things down. For the data frequency itself, we support just about any frequency including data that changes thousands of times per second or more. And yes, due to our unique approach to interacting with data across many sources without the requirement to migrate or copy data, we can do this at virtually any scale. We've customers with over 100 data sources running against a single Transpara system, others with hundreds of thousands of KPIs moving in real-time, and still more with data that changes hundreds or thousands of times per second.
What is meant by “near real-time?
Near real-time, sometimes summarized as NRT, is a technical term used to define the exact parameters of “real-time” in the context of data processing. While Transpara is all about speed, we're not a control system and we're not flying fighter jets. Regardless of the frequency of the data itself, Transpara users aren't looking for their screens to update more than every few seconds. In fact, updating faster than NRT would be a distraction and annoying when it comes to visualization. Outside of that, we're also normally working with data in different locations (cloud and on-premise, internal or external, different physical sites around the world, etc) so physics always plays a role in how fast data can logically travel to the platform and out to users. Summary: It's really fast, but not hard real-time.
How fast of data can you support (frequency)?
Transpara can support data resolution up to thousands of samples per second (and even demonstrated picosecond resolution once). While few operational environments require such high-frequency data, we've architected our system to support whatever might be thrown at it.
How much data can you store, and for how long?
First, there is no requirement to store your data in Transpara, as we easily leverage your existing data sources and applications without the need to migrate or copy data. That said, Transpara includes a high-scale, high-frequency time-series and relational database that can be used as a cache for analytics or as a primary data store, and there is no architectural limit to the amount of data that can be stored (at full resolution). Most of our customers store all of their data forever (decades) with commodity infrastructure and without the need for separate archiving, lossy compression or cold storage.
Is there a limit to the number of metrics I can implement?
No, there is no limit to the number of metrics you can implement. We've existing customers with hundreds of thousands of KPIs and extensive hierarchies in production for years, and internally we test everything to millions of metrics, KPIs, groups and more. If you have a larger environment, we would love to work with it.
How do you handle security? What if I have extreme or unique requirements?
Transpara slots into your existing security requirements using our “security inheritance” model. This means that your existing security model and/or requirements are respected without imposing new methods or disrupting your existing environment. This applies not only to authentication (support for almost all auth mechanisms including VPN, SSO, 2FA, etc), rights assignment (native integration with your existing directory and groups/users), and encryption choices (SSL, at-rest, in-transit, etc).
Do you support extreme environments (high-safety, high-security, high-frequency, high-reliability, etc)?
Yes. Transpara has hard-core industrial roots and is used daily in high-security, high-safety, high-frequency and high-reliability environments like nuclear power, oil refining, satellites, manufacturing, telecommunications, and more. Even though that's our expertise, we also are happy with slower-moving data or less-than-mission-critical environments too.
Is this platform a Historian?
Transpara isn't a competitor to traditional historians, but does include a high-scale, high-speed time-series database. For most of our customers, Transpara interfaces directly with existing historians (and many other sources) to read historical, current and future data, including:
- AVEVA OSIsoft PI (and AF)
- GE Proficy
- Aspentech inmation and IP.21
- Rockwell, Honeywell, Yokogawa, Siemens, OAS, Ignition, Cognite, Canary and others
- Relational historians (based on SQL Server or other platforms)
- Open source time-series databases (InfluxDB, TimescaleDB, etc)
- Cloud time-series databases (AWS Timestream, Azure ADX and TSI, Timescale Cloud, etc)
For customers that need to execute simple or advanced analytics outside of their historian, or when spanning multiple data sources with their calculations or algorithms, Transpara time-series database serves as an analytics cache. For customers without an existing historian who are in need of a modern and cost-effective solution, Transpara's TSDB can serve as an alternative to traditional historians.