Frequently Asked Questions
This page contains a list of frequently asked questions (FAQs) that are grouped under different categories. You can find the categories presented below:
Technical
Implementation
Integrations
Cost & ROI
Competition
Use Cases & Customers
Using the Software
QuickStart Pilot
Support & Services
Company Background, History & Expertise
Technical Questions
Can I override the status of a KPI?
Yes, it's possible to use a manual override or a dynamic override based on a condition or a value in a data source.
How Do I Set an Asset Status to 'Not in Service' and Stop Alerts?
The best way to stop false alerts in Visual KPI when you have a piece of equipment that's OFF is to set the status to Not in Service.
Can I share, open or link to a specific dashboard, regardless of what profile is currently selected?
Yes, and you have multiple options for linking to dashboards:
- Create several dashboards in the same profile and use the pulldown menu to choose the one you want to view.
- Add a link via Customize Dashboard.
- Pin a link to the Bookmark Bar.
To learn more about each of these options to Customize Your Visual KPI Dashboard, refer to the Dashboard page of the Basic Navigation guide.
How to share or link to a specific Dashboard?
Sometimes you need to quickly share a specific dashboard with a colleague or create a link to a dashboard for the bookmark bar or another dashboard. For most objects in Visual KPI, the URL address in your browser will work, but dashboards are a bit different:
- Dashboards have a specific URL in your browser that looks something like this: http://demo.transpara.com/tandd/?pid=0, where “?pid-0” means “the dashboard” but not a specific dashboard. This is because Visual KPI remembers what dashboard the user was last using, or goes to the default dashboard if this is the first visit from a browser.
- Because of the above, if you want to share a specific dashboard or get its exact URL you need to use the share button (for users) or get the dashboard ID in the Visual KPI Designer (for admins).
- A specific dashboard link will include the ID and look like this: http://demo.transpara.com/tandd/?pid=0&dashid=de1bfb47-efa3-4f1a-b9f6-eae566317ff1
You can find the URL link to a specific dashboard, KPI, or any page you are viewing via the Share button. If you are an administrator, you can also get the link to a specific dashboard from the GUID in Visual KPI Designer.
Link to a specific dashboard via Share
To link to a specific dashboard via Share, follow the steps below:
- Click the Share button on the Visual KPI navigation bar to get the URL of any page you are viewing.
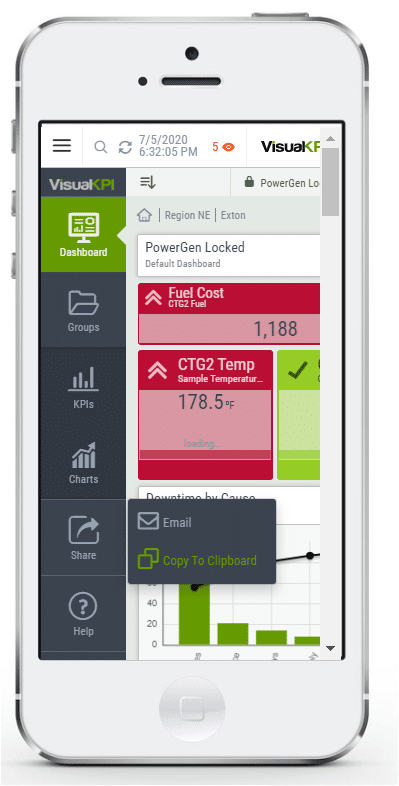
- Use Copy to Clipboard to copy and then paste the dashboard link into any application.
The Email option opens your email account with a pre-populated message that automatically includes the specific URL to the dashboard or page you are currently viewing.

Link to a specific dashboard via Visual KPI Designer
In Visual KPI Designer, you can link to a specific dashboard by doing the following:
- Navigate to the Dashboard or KPI you want to link to.
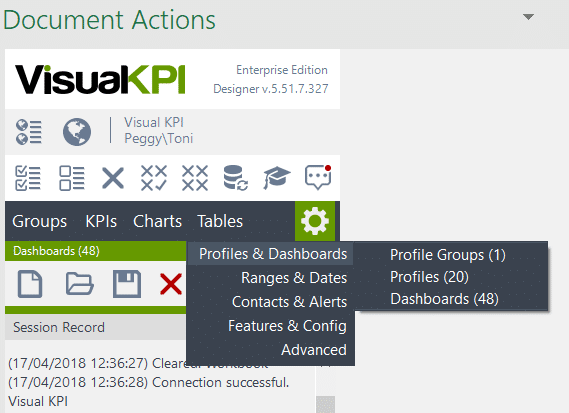
- Find the Dashboard ID.
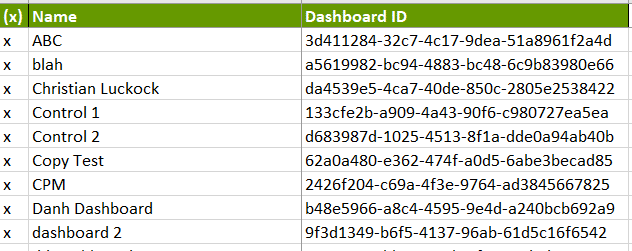
- To link to the Dashboard, use "dashboard: GUID". it will look like this:
dashboard:3d411284-32c7-4c17-9dea-51a8961f2a4d
Learn more
To learn more about this feature, follow the links below:
Can the OLAP Interface be used for data which has both a time and date field in the cube?
Yes, the OLAP interface supports cubes with date only or with date and time dimensions. Since all cubes are different, you will need to write a query that uses the correct dimension names, but the pattern is the same.
Date only Cubes
For cubes with date only, use the following keywords in your queries:
STARTDATEENDDATETIMESTAMP
Cubes with time as dimension
For cubes that include time as a dimension, you'll use the new reserved keyword extensions:
-
StartDate
{STARTDATE}{STARTDATE.Date}{STARTDATE.Time}
-
EndDate
{ENDDATE}{ENDDATE.Date}{ENDDATE.Time}
-
TimeStamp
{TIMESTAMP}{TIMESTAMP.Date}{TIMESTAMP.Time}
If you have existing queries with both Date format and Time format, you will need to modify the trend queries to use {STARTDATE.Date} and {ENDDATE.Date}.
Example Queries
Below are some example queries that incorporate the new keywords. Note the use of the keywords in each example. For this example:
- Input
{0}: KPI Name - Input
{1}: KPI Aggregation Type
Current Value query
The Current Value query requires nothing special as the TAIL function handles it.
SELECT [Measures].[{1}] ON COLUMNS,
{TAIL(NONEMPTY([Date].[Date].Members*
[Time].[Time].[Time].ALLMEMBERS))} ON ROWS
FROM [CubeName]
WHERE ([KPI].[KPI].[{0}], [Time Zone].[Time Zone].[(UTC) Coordinated Universal Time]);
Trend Data Query
The Trend Data query retrieves all data for each day on both ends of the query, then discards the unused portions of the days.
SELECT {[Measures].[{1}]} ON COLUMNS,
NONEMPTY{[Date].[Date].[{STARTDATE.Date}]:[Date].[Date].[{ENDDATE.Date}] *
[Time].[Time].[Time].ALLMEMBERS} ON ROWS
FROM [CubeName]
WHERE ([KPI].[KPI].[{0}], [Time Zone].[Time Zone].[(UTC) Coordinated Universal Time]);
Historical Value Query
The Historical Value query uses the .Time keyword.
SELECT [Measures].[{1}] ON COLUMNS,
TAIL(NONEMPTY([Date].[Date].FirstChild:[Date].[Date].[{TIMESTAMP.Date}] * [Time].[Time].FirstChild:[Time].[Time].[{TIMESTAMP.Time}])) ON ROWS
FROM [CubeName]
WHERE ([KPI].[KPI].[{0}], [Time Zone].[Time Zone].[(UTC) Coordinated Universal Time]);
How OLAP queries work
The table below shows details for how these OLAP queries work. (STARTDATE, ENDATE & TIMESTAMP behave the same way.) Given the following data:
- Input date: 12/25/2016 1:00:00 PM
- Default Date Format: yyyy-MM-dd
- Default Time Format: HH:mm
| Date Format | Time Format | Result for TIMESTAMP | Result for TIMESTAMP.Date | Result for TIMESTAMP.Time |
|---|---|---|---|---|
| NONE | NONE | 2016-12-25 13:00 Note: uses default Date & Time format | 2016-12-25 Note: uses default Date format | 13:00 Note: uses default Time format |
| NONE | HH:mm | 2016-12-25 13:00 Note: uses default Date format & User Defined Time format | 2016-12-25 Note: uses default Date format | 13:00 Note: uses User Defined Time format |
| yyyy-MM-dd | NONE | 2016-12-25 Note: uses default Date format ONLY | 2016-12-25 Note: uses default Date format | INVALID |
| yyyy-MM-dd | HH:mm | 2016-12-25 13:00 Note: uses User Defined Date & Time format | 2016-12-25 Note: uses User Defined Date format | 13:00 Note: uses User Defined Time format |
How do I delete an Interface from Visual KPI Server Manager?
Visual KPI won't allow you to delete an interface when you have associated data. If you're trying to delete an interface via Visual KPI Server Manager, you may get a message that looks like this:
Interface [interface name] is referenced and can't be deleted.
Deleting an interface in Visual KPI requires removing all associated data, including KPIs, Charts, and Trends, before using Visual KPI Server Manager.
Can I hide the Visual KPI navigation menu by default?
You can embed a Visual KPI screen in a browser menu to display only real-time data, hiding other navigation elements and page elements. To do this you need to add the word embed into the URL of the selected Visual KPI screen.
Using the URL below as example:
https://demo.transpara.com/PowerGen?pid=0
Adding embed it would become the following URL:
http://demo.transpara.com/PowerGen/embed?pid=0
Access both links above to see the difference between them.
Why is part of Visual KPI Designer toolbar missing in the Document Actions pane?
Certain combinations of Microsoft Windows, Microsoft Office, and VSTO Runtime may cause the Visual KPI Designer toolbar to disappear from the Document Actions pane.
Here are some possible solutions to fix the issue you're experiencing with Visual KPI Designer. We recommend starting with Solution 1 and after applying each fix, restart your computer and reopen the program. If one solution works, then you're good to go. However, if the issue still persists, then try the next solution.
Solution 1: Optimize Microsoft Excel
To optimize Microsoft Excel, follow these steps:
- Open Microsof Excel.
- Click File > Options.
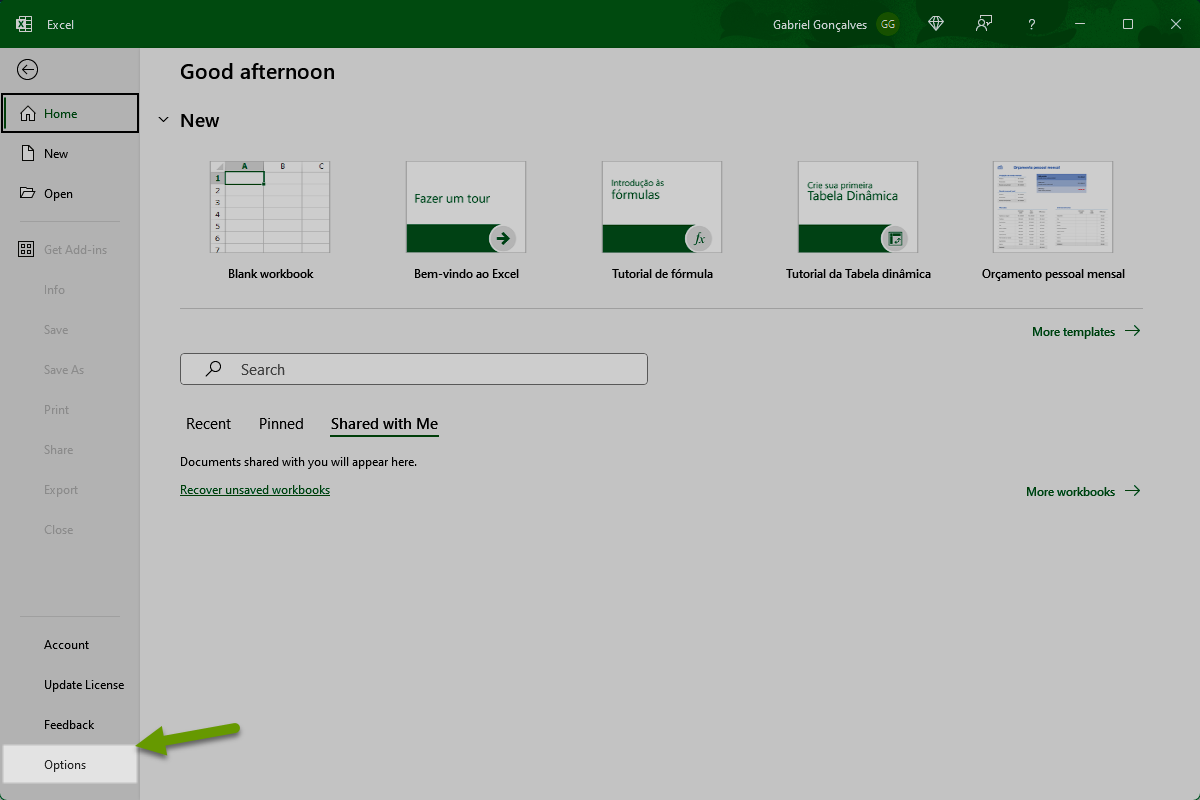
- In the General tab, select the radio button for Optimize for compatibility.
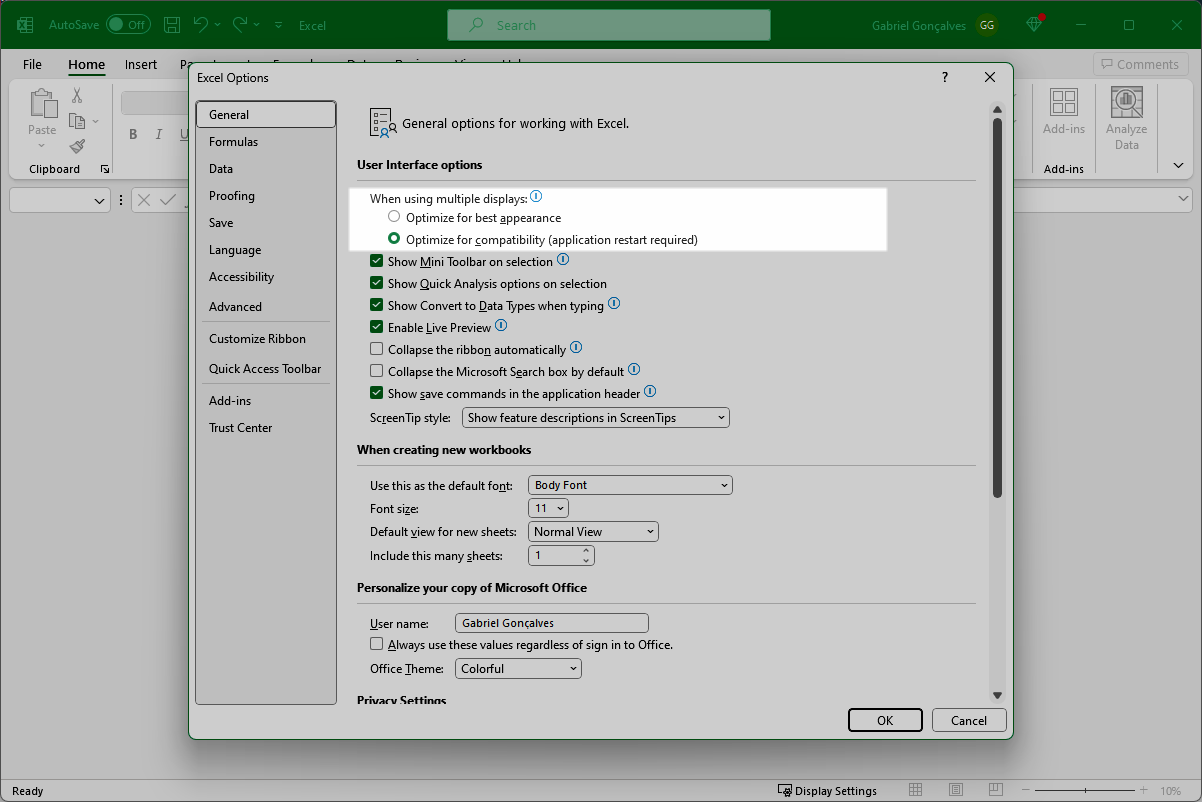
If the radio button isn't visible in the User Interface options, you may have an outdated version of Microsoft Office.
Solution 2: Optimize Windows Display Settings
To optimize Microsoft Windows Display Settings, follow these steps:
- In Windows, right-click on the desktop, and select Display Settings.
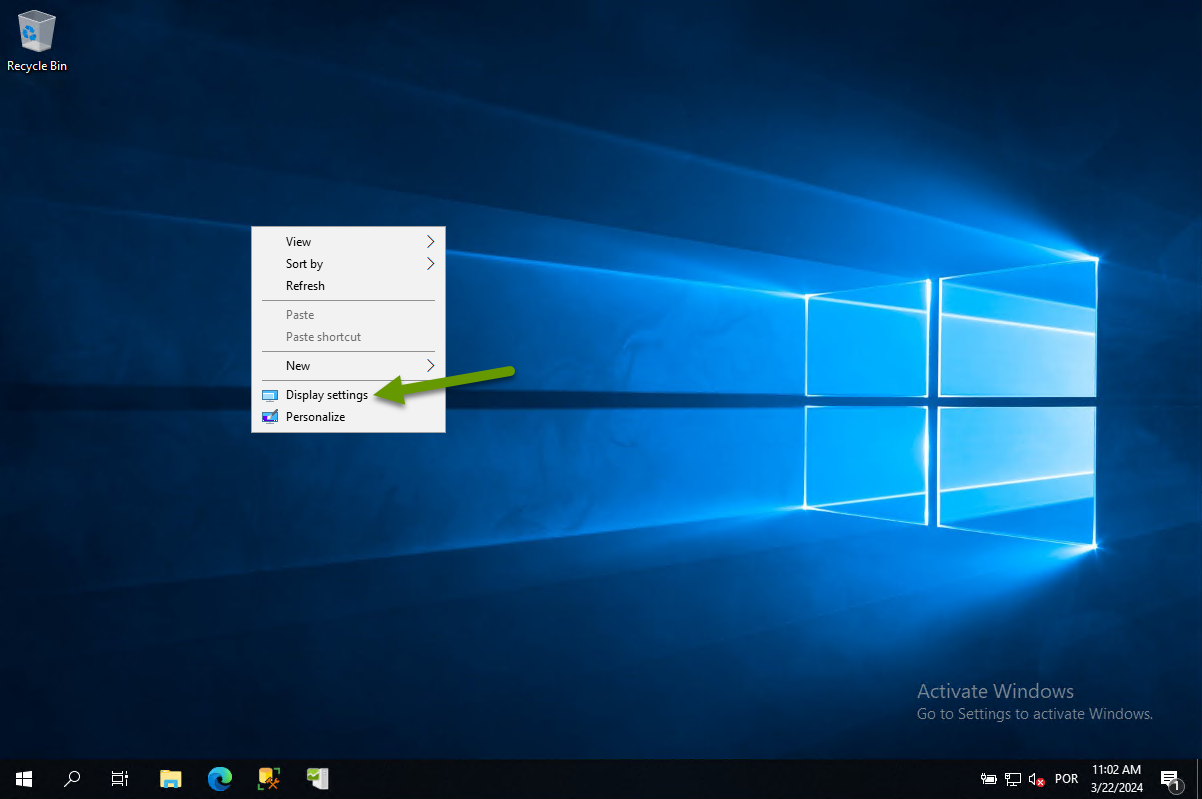
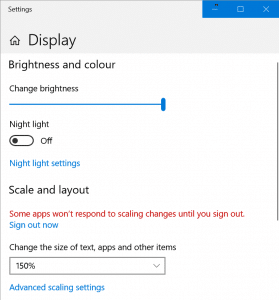
- Change the size of text, apps, and other items from the default (120%) to 150%.
Solution 3: Update to the latest version of Microsoft Office
Once you update Microsoft Office, try restarting your computer. If this resolves the issue, that's great. But you may need to also Optimize Microsoft Excel (Solution 1).
Solution 4: Update to the latest VSTO Runtime
Download the latest version of Visual Studio 2010 Tools for Office Runtime: aka.ms/vstoruntime
For more information on the cause and possible fixes for this issue, refer to this Microsoft support page.
What ports does Visual KPI need to access an interface located behind a firewall?
The default ports are 80 for HTTP and 443 for HTTPS, but you can configure any ports you wish in IIS.
If an interface is separated from its endpoint connection, the port used by the interface must be opened between the Transpara Web server and the data source.
For example, if you're using OSIsoft PI as the data source and there's a firewall between the Transpara Web server and PI server(s), you'll need to open port 5450 to allow inbound traffic to OSI PI coming from our use of the PI or AF SDK.
If you need help with a specific scenario or data source, contact our Support.
Is this a SaaS application or can we host it ourselves (on-premise or our own cloud)?
Transpara isn't a SaaS application, so you are never sending your data to us or relying on us to manage security, privacy, users or your intellectual property. The software can live on-premise or in your own private or public cloud environment, under your control and following your own IT and security policies. It's cloud-friendly (containers, scale-out, etc) but equally at home on servers or virtual machines inside your own local environments or data centers.
Is Transpara just a data visualization application?
No. While Transpara is well-known for its visualization capabilities and user experience, it's an entire operational intelligence, monitoring, alerting, and analytics platform that includes interfaces to thousands of sources (read and/or extract), a high-scale contextual layer with limitless attributes and templates (knowledge graph), an advanced high-scale advanced analytics engine, a powerful time-series data store and more. It can even be used with other visualization software (even though we're quite proud of ours).
Is the view actually real-time, and is that sustainable at scale?
The view is technically “near real-time” which means the visualizations on the screen update automatically in just seconds when data changes, and moving around in time or drilling in for more detail doesn't slow things down. For the data frequency itself, we support just about any frequency including data that changes thousands of times per second or more. And yes, due to our unique approach to interacting with data across many sources without the requirement to migrate or copy data, we can do this at virtually any scale. We've customers with over 100 data sources running against a single Transpara system, others with hundreds of thousands of KPIs moving in real-time, and still more with data that changes hundreds or thousands of times per second.
What is meant by “near real-time?
Near real-time, sometimes summarized as NRT, is a technical term used to define the exact parameters of “real-time” in the context of data processing. While Transpara is all about speed, we're not a control system and we're not flying fighter jets. Regardless of the frequency of the data itself, Transpara users aren't looking for their screens to update more than every few seconds. In fact, updating faster than NRT would be a distraction and annoying when it comes to visualization. Outside of that, we're also normally working with data in different locations (cloud and on-premise, internal or external, different physical sites around the world, etc) so physics always plays a role in how fast data can logically travel to the platform and out to users. Summary: It's really fast, but not hard real-time.
How fast of data can you support (frequency)?
Transpara can support data resolution up to thousands of samples per second (and even demonstrated picosecond resolution once). While few operational environments require such high-frequency data, we've architected our system to support whatever might be thrown at it.
How much data can you store, and for how long?
First, there is no requirement to store your data in Transpara, as we easily leverage your existing data sources and applications without the need to migrate or copy data. That said, Transpara includes a high-scale, high-frequency time-series and relational database that can be used as a cache for analytics or as a primary data store, and there is no architectural limit to the amount of data that can be stored (at full resolution). Most of our customers store all of their data forever (decades) with commodity infrastructure and without the need for separate archiving, lossy compression or cold storage.
Is there a limit to the number of metrics I can implement?
No, there is no limit to the number of metrics you can implement. We've existing customers with hundreds of thousands of KPIs and extensive hierarchies in production for years, and internally we test everything to millions of metrics, KPIs, groups and more. If you have a larger environment, we would love to work with it.
How do you handle security? What if I have extreme or unique requirements?
Transpara slots into your existing security requirements using our “security inheritance” model. This means that your existing security model and/or requirements are respected without imposing new methods or disrupting your existing environment. This applies not only to authentication (support for almost all auth mechanisms including VPN, SSO, 2FA, etc), rights assignment (native integration with your existing directory and groups/users), and encryption choices (SSL, at-rest, in-transit, etc).
Do you support extreme environments (high-safety, high-security, high-frequency, high-reliability, etc)?
Yes. Transpara has hard-core industrial roots and is used daily in high-security, high-safety, high-frequency and high-reliability environments like nuclear power, oil refining, satellites, manufacturing, telecommunications, and more. Even though that's our expertise, we also are happy with slower-moving data or less-than-mission-critical environments too.
Is this platform a Historian?
Transpara isn't a competitor to traditional historians, but does include a high-scale, high-speed time-series database. For most of our customers, Transpara interfaces directly with existing historians (and many other sources) to read historical, current and future data, including:
- AVEVA OSIsoft PI (and AF)
- GE Proficy
- Aspentech inmation and IP.21
- Rockwell, Honeywell, Yokogawa, Siemens, OAS, Ignition, Cognite, Canary and others
- Relational historians (based on SQL Server or other platforms)
- Open source time-series databases (InfluxDB, TimescaleDB, etc)
- Cloud time-series databases (AWS Timestream, Azure ADX and TSI, Timescale Cloud, etc)
For customers that need to execute simple or advanced analytics outside of their historian, or when spanning multiple data sources with their calculations or algorithms, Transpara time-series database serves as an analytics cache. For customers without an existing historian who are in need of a modern and cost-effective solution, Transpara's TSDB can serve as an alternative to traditional historians.
Implementation Questions
How to obtain hash values for the Visual KPI installation?
If your organization's IT governance has strict requirements for ensuring that our installation media haven't been altered, you can contact our Support. We will be happy to provide you with the relevant MD5 or SHA checksum to validate any Visual KPI build that you require.
Why checksums matter
MD5 (or SHA-1, SHA256, , SHA512, ccHas64) are mathematical functions that originated in the cryptography discipline. It's a long string of digits that gets computed by reading the binary executable we make.
Learn more about MD5
Transpara uses a string of digits as a "checksum" to ensure the integrity of its downloadable executables. You can find this string of digits on our website along with the downloadable .exe file. Once you download the file, you can run an MD5 or SHA hash checker on it and compare the generated string with the one on our website. If the strings match, you can be confident that the file you are installing is the same as the one we posted online.
It's important to ensure that the files you place on your computer are safe and haven't been tampered with by someone else. A checksum is a way to guarantee that a file has not been modified to be harmful by a third party before it reaches your computer. While you can trust Transpara, it's a good idea to check that no one else has intercepted the files while they were being transferred over the internet.
Can the # symbol be removed for a KPI with no Low-High interface?
If a KPI has no Low High interface it displays # symbol.
You can set the Status to Good or anything else you wish. Use Visual KPI Designer to set the Status column, and the pull-down menu to set the value.
Visual KPI Search: What Fields or Attributes Are Used?
The Visual KPI search function provides a comprehensive search result of dashboards, groups, KPIs, charts, and tables that match with your input. It returns results in real-time, along with the status of KPIs and groups that contain KPIs.
So what attributes the search function uses to generate results?
| Field | Attributes |
|---|---|
| Dashboards | name, description. |
| Groups | name, description. |
| KPIs | name, description, actual lookups (tags, equations, etc.) |
| Charts | name, description. |
| Tables | name, description. |
| Trends | pen names, pen lookups. |
Visual KPI will continue to improve by adding more search attributes over time. If you have any questions, contact our Support.
To learn more about how to use Visual KPI seach feature refer to the Search page of the Basic Navigation guide.
Do I have to move or migrate all of my data into the Transpara platform?
No. Transpara isn't a data lake unless you specifically want it to be. Transpara is designed to leverage your existing data sources and applications to provide immediate value without an expensive, time-consuming data migration project. Most of our customers leave their data in existing sources (wherever makes the most sense) and put that data to use in Transpara on the fly. It even lets you change your data sources without disruption.
Can you automate the system (initial and ongoing configuration)?
Yes. Transpara gives you the power to automate the configuration of the system based on existing applications or systems. Using a Transpara Remote Context Service (RCS), the system reads metadata dynamically from applications like AVEVA OSIsoft AF, VMware, Zabbix, Aspentech inmation and other applications where this information lives. We even support RCS creation against custom sources of configuration information. You can learn more about our RCS feature at [training link].
Is this a SaaS application or can we host it ourselves (on-premise or our own cloud)?
Transpara isn't a SaaS application, so you are never sending your data to us or relying on us to manage security, privacy, users or your intellectual property. The software can live on-premise or in your own private or public cloud environment, under your control and following your own IT and security policies. It's cloud-friendly (containers, scale-out, etc) but equally at home on servers or virtual machines inside your own local environments or data centers.
How easy is it to move Transpara between platforms (e.g. to new hardware, from on-premise to cloud, or between different cloud providers)?
Transpara is a completely portable platform with no specific allegiance to hardware, VM platforms or cloud providers. It's also a product, so it's simple to migrate or move between systems. We've hundreds of on-premise systems running at customers and in various private or public cloud environments (Azure, AWS, GCP). Curious about a specific implementation? Just ask our Support.
How easy is it to move Transpara out of the stack if we're unhappy (export data, etc)?
Very easy. Transpara doesn't lock you in or make it difficult to get at your data or migrate away, even if we're a primary data store or if you have significant analytics defined and executing in the platform. We hate being held hostage by vendors just as much as you do.
Do you support templates?
Yes. Transpara supports templates at any level, including but not limited to the following:
- Group templates (hierarchy and asset model)
- KPI templates
- Custom attribute templates
- Calculation and algorithm templates
- Chart templates
- Table templates
- Dashboard templates
We work with high-scale and large systems where templates are critical for success. It would be impossible to manage a system with hundreds of thousands of metrics if there were no templates.
How long does a typical implementation take?
As little as 90 minutes in some cases, but to be safe we usually say it's measured in days, not weeks or months. Transpara is a product, so the deployment is straightforward and doesn't involve custom code or project-ware. The length of time your implementation will take will depend on your specific needs, but Transpara was designed to eliminate deployment time and risk (which benefits you and us). In extremely complex environments, we would still have you operational in less than a month.
What customer resources are required for implementation?
This depends heavily on your specific use, but in most cases we require just the following:
- A home for the software. This can be a local virtual machine on an existing server, dedicated on-premise hardware, or a cloud environment. Detailed system requirements and prerequisites can be found at the Installation guide.
- Access to the appropriate staff on your side. This usually includes the following:
- Staff with knowledge of and access rights to your data sources and the environment Transpara will run on.
- Staff with knowledge of the use case and “what you want to achieve.” This is often operations staff, management or others who can answer questions like what core metrics should be enabled up-front, how data should be organized, what makes your initial KPIs good or bad (limits, targets).
Deployment is handled remotely via web meetings and Transpara does not require direct access to your systems.
Integrations Questions
Does Visual KPI OPC Interface Support Real-time & Historian Values?
Transpara's Visual KPI Enterprise ADI option includes OPC support, which can handle various OPC flavors, such as:
- OPC-DA
- OPC-UA
- OPC-AE
- OPC-HDA
Transpara offers complete support for all OPC-related requirements. To learn more about Visual KPI Enterprise ADI or OPC support contact our Support.
Can I send Alerts via Microsoft Office 365?
You can send Visual KPI alerts via Microsoft Office 365, but you need to configure SMPT emails in IIS to have them delivered from the Visual KPI server to an Microsoft Office 365 email account.
You must have a Microsoft Office 365 account with email enabled.
Is there a limit to how many data sources you can integrate to?
We've support for thousands of sources and even have one customer interfacing with over 100 sources against a single Transpara system. You can mix and match data from various sources, combine data from multiple sources using calculations, and even get various attributes dynamically from source (for example, get location data for a group or KPI for a moving object from one source while the data comes from other sources).
Are we required to ingest or copy data into Transpara?
No. One of the most unique aspects of Transpara's approach is that you can leave data in your existing systems and put it to use on-the-fly, leveraging your existing investments and eliminating the most costly, time-consuming and painful part of any data project. If or when required, data can be stored in Transpara time-series analytics cache for the purpose of time-based calculations, analytics that span multiple data sources, or when you don't already have existing sources.
What are the most common data sources you integrate with?
Transpara can interface with thousands (probably millions) of data sources and applications, including industrial systems that many other applications have less experience with, such as historians/time-series databases, SCADA, OPC, IoT/IIoT, control systems, MQTT and others. We like to put data sources into a few large categories as follows:
- Proprietary historians (those that require the use of an SDK), such as AVEVA OSIsoft PI and AF, Aspentech (IP.21 and inmation), GE and many others.
- Other time-series databases, including historians, open source (TimescaleDB, InfluxDB, etc), and cloud time-series databases (AWS Timestream, Azure ADX or TSI, Timescale Cloud, etc).
- Relational databases (SQL Server, Oracle, MySQL, PostgreSQL, etc) and any applications built on relational databases (vertical industry applications, ERP, CRM, LIMS, etc).
- Data lakes, data warehouses, OLAP and big data sources.
- Web services, including both internal (any application with a REST API) or external (like weather, commodity pricing, traffic, etc). This includes JSON, XML, Python, etc.
- IoT/IIoT and other sensor data. This includes OPC, Modbus, MQTT, SNMP and many other protocols.
- Slow moving or manually entered data, including manual data entry features in Transpara along with Excel, CSV, web form applications and more.
- IT, Cloud and Security data, including applications like VMware, Zabbix, Splunk and many others.
Even if we've never encountered a particular data source, there are usually no technical limitations stopping us from interfacing with it. Usually the only thing that gets in our way is politics.
Can I integrate my advanced data science tools with Transpara?
Yes. Transpara believes you should leverage all of the tools and applications that provide value to you. We support integrations with data science tools like Jupyter Notebooks, R, Python and specialized or cloud-based analytics platforms (machine learning, AI, etc). If you are curious about integration with a specific tool or application, just reach out to our Support and we can discuss it.
Can you integrate with our business intelligence tools?
Yes. Transpara easily integrates with applications like Power BI, Tableau and others, either as a source of data for Transpara or as a client tool for analysis and reporting.
We use Excel for many things. How does Transpara work with Excel?
Transpara works with Excel in several ways:
- As a data source with our native Excel interface,
- With the native ability to export data to Excel/CSV for further analysis and charting, and
- Our native authoring client (Transpara Designer) is based on Excel so it's already familiar to new users. Excel is widely known as the most popular developer language and analytics tool on the planet, so we integrate deeply wherever possible.
Cost & ROI Questions
Where Can I Find the Expiration Date of My Visual KPI License?
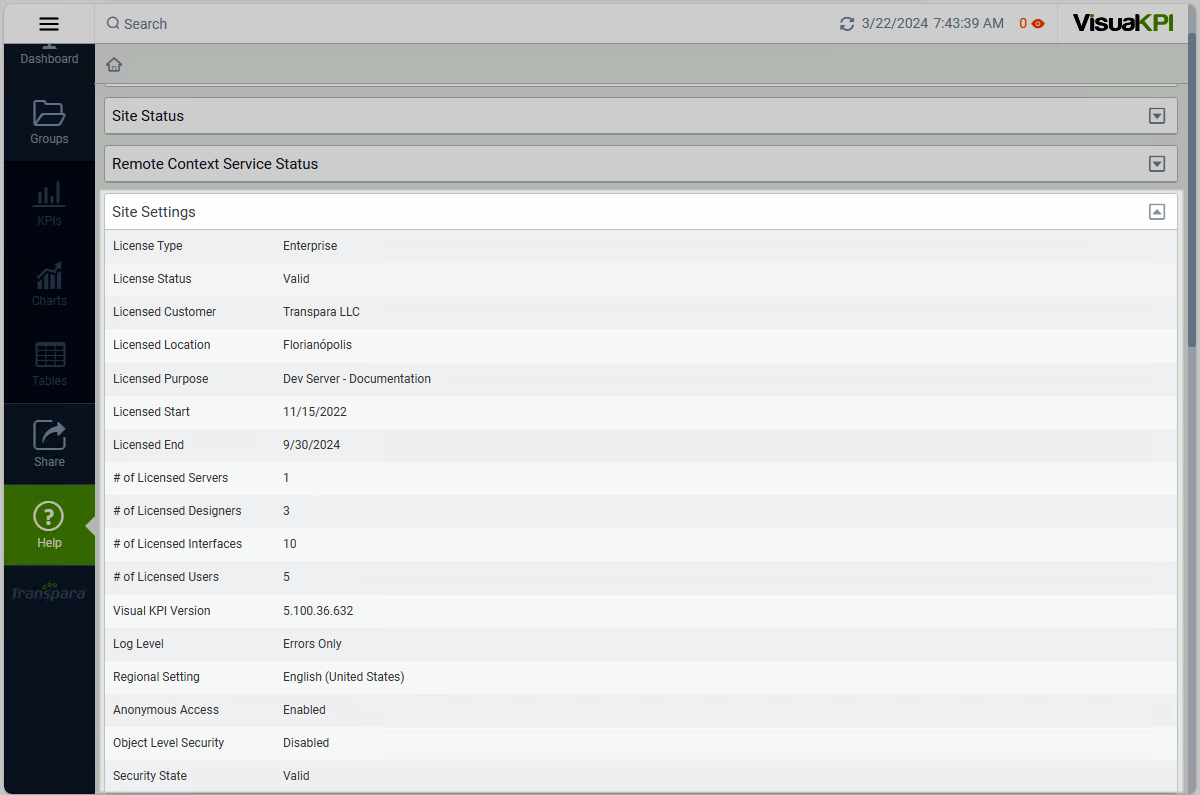
You can find your Visual KPI license expiration date and additional information about your Visual KPI site on the Help screen of your site. Follow the steps below to find the detailed information:
- In your Visual KPI site, click Help in the navigation menu.
- At the bottom of the Site Status section you will find a link For detailed information about this Visual KPI site please click here. Click it.
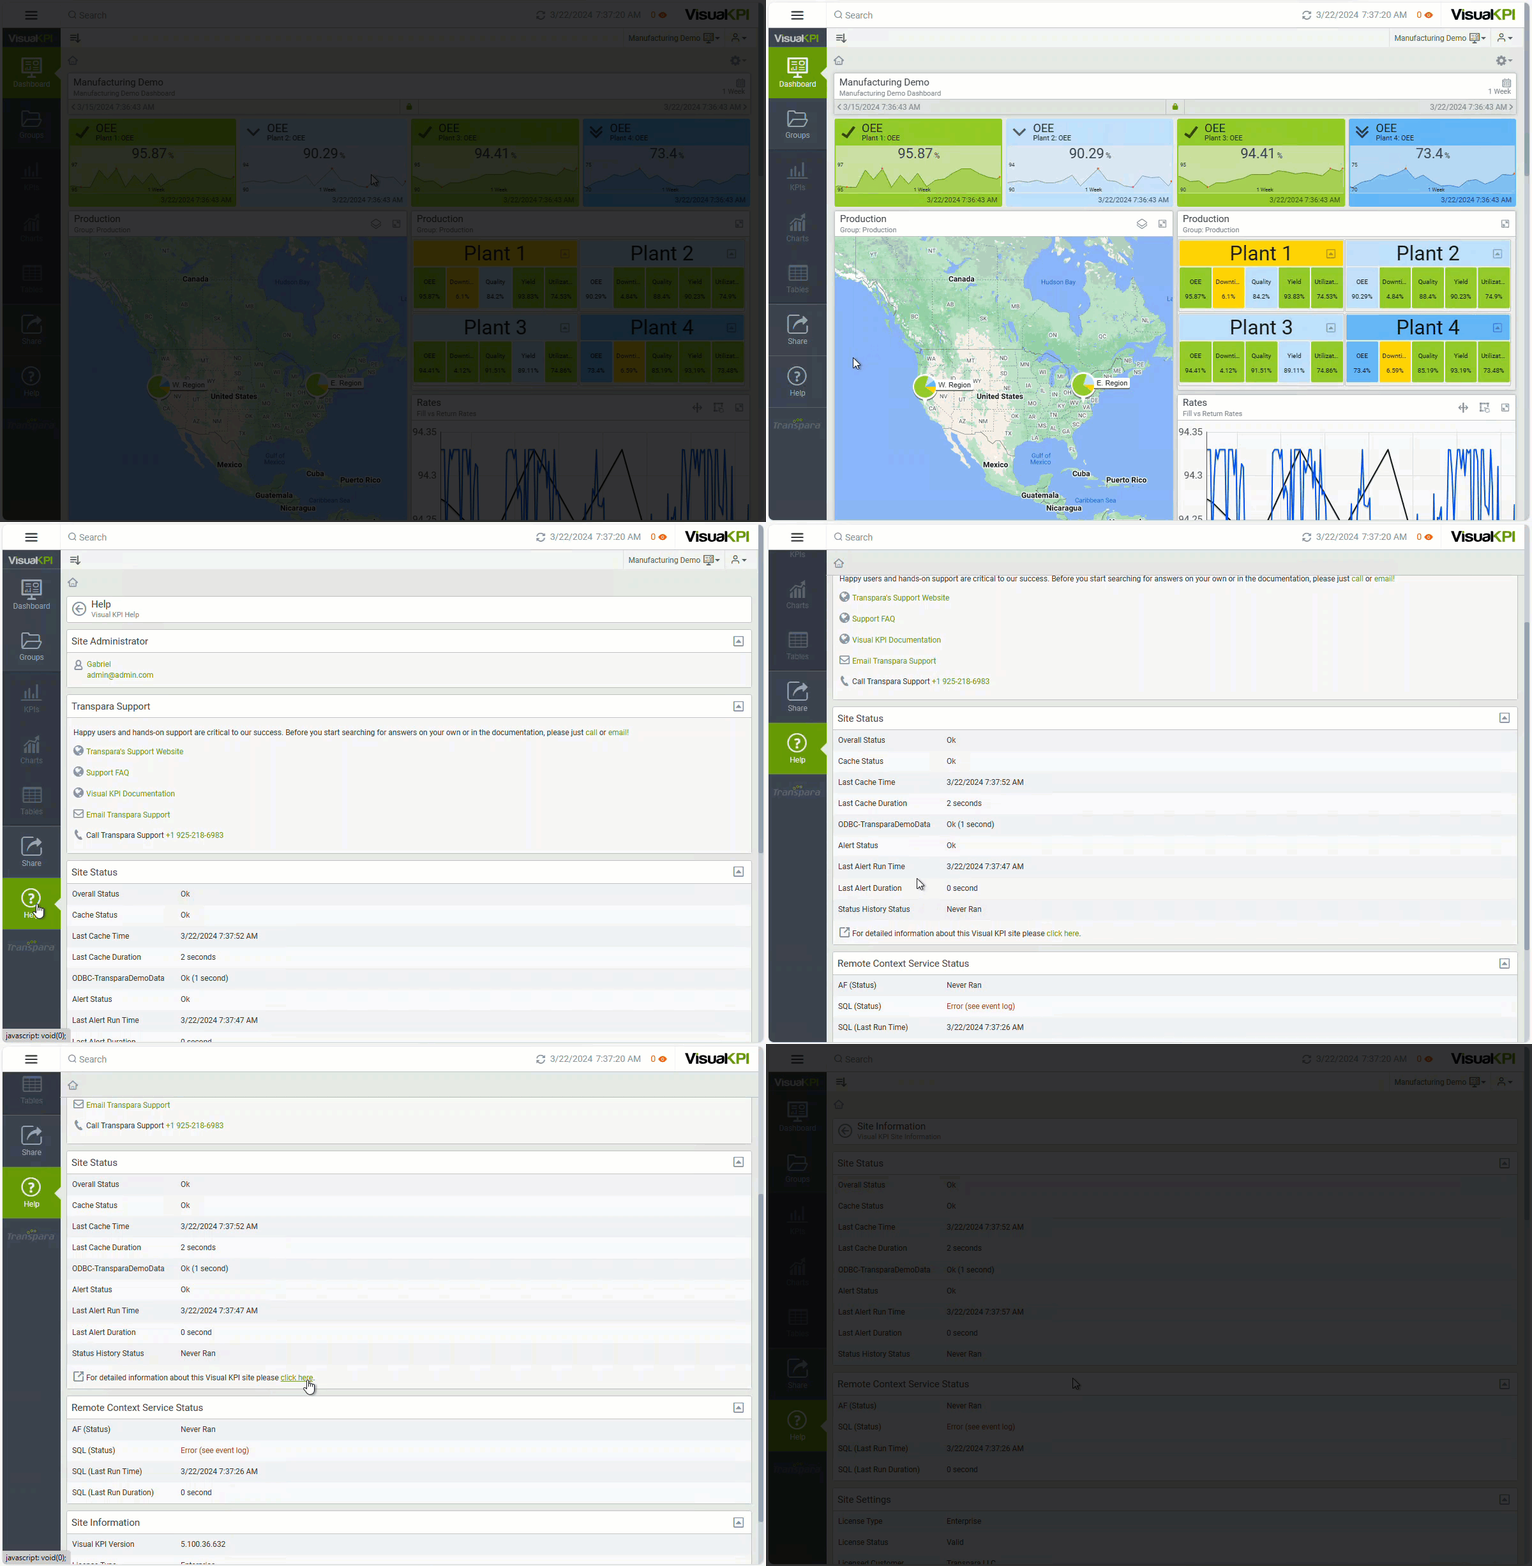
Under the section Site Settings, you will find your license key details and additional information about your site. This is exemplified in the image below:
Why do I get a license key error message in Visual KPI Server Manager?
If you encounter a license key error message that says "Failed to save license key" while attempting to add your license key in Visual KPI Server Manager, it's likely due to the logged-in user lacking write permissions in SQL Server for the Visual KPI database.
To resolve this issue, consider the following steps:
-
Check Permissions: Ensure that you have the necessary permissions assigned to you. If not, request the appropriate access rights from your system administrator.
-
Delegate the Task: Alternatively, if you don't have the required permissions, ask someone with the necessary access rights to apply the Visual KPI license key within Visual KPI Server Manager.
Remember that proper permissions are crucial for successful license key management in Visual KPI. If you need further assistance, contact our Support.
Learn more about the SQL Permissions needed in the Prepare your System page.
How is the system priced? What is the rough cost I should expect?
You can find all of the details about our pricing model and options at https://transpara.com/pricing. We offer multiple tiers of features, including Pro, Enterprise, and Enterprise ADI, and within each tier it's priced by the number of users who will access the system (named or concurrent users).
To get an estimate for your particular situation, please contact our Support.
What licensing models do you support?
Transpara offers a range of licensing models, with the default being annual subscription licenses with a 3-year term. Additional discounts apply to longer term commitments. We also offer various custom licenses including site, corporate and enterprise licenses or volume-based licenses.
What are your license terms?
You can review our license and service terms & conditions here.
Do you offer volume discounts or discounts for multi-year licenses?
Yes. We have volume price breaks as the number of users increases, and we offer additional discounts for longer-term commitments.
Can I upgrade or change my license?
Yes! We support expansion or changes to your license at any time, including changing plans or models, adding users, and other changes. Just reach out to us if you want to make changes.
What happens if I go over my license volume temporarily?
Transpara's licenses contain a Fair Use Policy because we understand that critical events occur from time-to-time and you should never be trapped during a crisis. We don't place hard limitations in the software, so if you need to share information with someone who isn't a licensed user, or go beyond the number of licenses you own, we are ok with that. it's only when you repeatedly or consistently violate the terms of your license do we need to increase your license or upgrade your plan. Our goal is to always be a trusted partner and a tool you can count on in a crisis.
How do I estimate ROI? What are the core factors to look at and how long should it take?
Overall, the ROI of any real-time operations and analytics platform will depend on how it's implemented, what use cases and data it surfaces, and the users that leverage it. While Transpara improves decision making, productivity, collaboration and the extracted value of existing investments, each of our customers achieves ROI in their own way. Because of this, we worked with our many customers to create a comprehensive ROI Guide which is available here.
Competition Questions
What is unique about Transpara's approach?
You can find all of the details about our pricing model and options at https://transpara.com/pricing. We offer multiple tiers of features, including Pro, Enterprise, and Enterprise ADI, and within each tier it's priced by the number of users who will access the system (named or concurrent users).
To get an estimate for your particular situation, please contact our Support.
What licensing models do you support?
As our customers often remind us, what makes Transpara special isn't a list of features or functions, but rather how unique our approach is. Below are some of the core aspects of our approach that set us apart from other data visualization, analytics, dashboard, and alerting applications:
-
It's a product, not a tool set: This means we go to great lengths to reduce the effort required to deploy, configure, maintain, upgrade, and support the software. With tools, you still have to build it. With Transpara, you just need to configure and personalize it. In fact, across our hundreds of enterprise customers, not a single one has a full-time person managing our software, even when rolled out globally across many sites. This is a radical and often underestimated benefit.
-
No requirement to migrate or copy data: We believe you should leave data where it makes sense, and if an existing application provides great value it shouldn't be replaced. Many companies are going to great lengths (cost, time) to centralize all of their data and move it to the cloud before putting it to use. While we work with those environments too, most of our customers leave data in place, eliminate the huge centralization project, and get right to creating value.
-
An obvious, modern user experience: Most of the tools in use at our customers require deep expertise and training to use, which limits who can use them and their ultimate benefit. Transpara takes most of its user interface design and patterns from consumer applications, which not only make for a more pleasant experience but eliminates the need for training and lets you put the application in front of more users.
-
Context and cognitive load: Most applications visualize tons of data but require the users to interpret it, look around, and figure out on their own what needs their attention. Transpara believes software should do more of the work, so we prioritize alerts so the system can proactively tell you when something needs your attention and take you right to it. When visualizing data, we focus on highlighting KPIs with color, status, and meaning that can be filtered easily to focus on issues and promote exception-based thinking. We focus on reducing the cognitive load required by users so your team can make better decisions faster.
-
Mobile-first: Long gone are the days where everyone is at their desk when things go wrong or opportunities are spotted. A core aspect of any real-time system is that your subject matter experts need access from anywhere to troubleshoot issues. With Transpara, every screen automatically works on any device and every feature is supported no matter what screen size. Oh, and we support huge screens too.
-
Automation: Transpara eliminates tons of manual effort through automated configuration capabilities like our Remote Context Service (RCS) and the ability for the software to change on the fly based on changing conditions.
-
Advanced analytics that are accessible: Transpara includes a powerful advanced calculation and analytics engine but also believes that not every user is a data scientist or python coder. This means that we provide analytics capabilities for every type of user, from simple math and drag and drop, to sophisticated features and integrations with advanced data science tools and AI/ML applications.
-
Fast and lightweight: Say goodbye to spinning circles while you wait for data to load. The way Transpara's interfaces work, along with keeping metadata and data separated, results in a lighting-fast application that never slows down your systems or makes your users wait.
-
Industrial strength scale and security: Transpara was born of industrial roots, so we're right at home monitoring and visualizing high-scale and frequently changing telco environments, nuclear power plants, mines, oil refineries, satellites, smart cities, and more. Even if you are only using it for slow-moving business data, you can benefit from the hundreds of industrial customers that battle-test it daily and have for years.
-
Customer support and expertise: Transpara aims to be the Nordstrom or Zappos of software. We love interacting with customers personally and everyone you will speak with is a deep expert in not only our product but often many of the other systems it interfaces with (and we often help with those too). We often tell customers to skip combing through the docs and instead, just jump on a web meeting with us and we will help you with any feature or question. Our support motto is simple: “Call for any or no reason.”
Can I replace existing applications with Transpara?
You can, but that doesn't always mean you should. It boils down to value. As an example, we often get asked by customers if they can replace their BI tools with Transpara, and the answer is usually no (unless they're trying to incorrectly use these tools for use cases we're much better for). In most cases, we start by leveraging existing tools to provide immediate value and then you can decide over time to replace other applications or modernize (without impacting how to use Transpara).
Do you compete with Power BI, Tableau, etc?
In most cases, no. Most of our customers also have BI tools and use them in complementary ways, but they're very different:
-
Different users: BI tools focus on analysts, report generators, and folks who work with more static data, while Transpara focuses on operations users like maintenance, safety, compliance, ops management, and others. BI tools also require deep training or data expertise to be useful.
-
Different use cases: BI tools focus on investigating past events, deep analysis of static data sets, report generation, and what-if analysis, while Transpara focuses on data that's in motion, alerting, early warning and prediction, leading indicators, exception-based monitoring, and other operational use cases.
-
Different data sources: There is often overlap and support for many by both applications, but BI tools really excel at relational and spreadsheet data, while Transpara excels at time-series, operational, industrial, and other moving data sources.
-
Different approach: BI tools are just that: tools. This means that users leverage them to build applications, create visualizations manually, import and massage data, and generate static reports. Transpara is an application that's fed from live data sources and is configured by defining KPIs, a hierarchy of information, and other core system patterns. Visualizations are generated automatically and are updated in near real-time without the need to create everything from scratch. It's also a system and not a set of separate pages that may or may not be related.
Transpara can also interface and integrate with existing BI solutions, extracting even more value in the process.
Do you compete with engineering tools like Seeq, Trendminer, PI Vision, etc?
In most cases, no. These tools are focused on engineers and deep trend analysis, so they're often used along side of Transpara at our customers. While they and many other applications can put data on a screen and have many trending features, the users, use cases and approach are very different. Transpara is often used for a larger number of users, including management, field staff, and operations to surface issues that may them be investigated in great detail using Seeq and others.
PI Vision and other tools from large industrial vendors (AVEVA, Aspentech, GE, Honeywell, ABB, Rockwell, Yokogawa and others) are usually tied to a single data source provided by that vendor and are less of a focus for those companies. Transpara is data source agnostic, so we easily span all sources and can aggregate data without requiring migration.
Why can't I just build this type of system myself (DIY)?
You can, but there are many reasons not to:
-
Focus: It puts you in the software business instead of your core business.
-
Maturity: The Transpara platform was developed over many years by industry experts and professional developers and provides a level of automation, productization, and ease of use that's difficult to replicate with a custom project.
-
Risk: When the original team leaves or changes jobs, the ability to maintain, support, and enhance the application also goes away. How many applications have died in this process.
-
Cost: The cost of a custom application is the sole burden of the customer, as opposed to a productized software company where you share that burden with the entire customer base.
-
Community: Often overlooked but equally critical is the global customer base of Transpara. Anyone who buys and uses our software benefits from the hundreds of customers that use it every day, battle-test it, submit support and feature requests to make it better, and create new and better use cases. Every improvement benefits all of the customers.
-
Support and expertise: Transpara is staffed by a team of experts who can provide support deployment assistance, configuration help, troubleshooting, and more — an especially valuable asset for organizations that don't have extensive in-house IT.
Use Cases & Customers Questions
Who are the users normally? Exec? Geeks? Senior vs junior?
Everyone from operators to management and field staff. We focus heavily on making software accessible to everyone, but never forget our ‘geek.' Some of our customers use Transpara in an IT sense but, then again, it often folds into other use cases for security, etc. Safety, quality, compliance/environmental, field staff/maintenance… Transpara works for everyone in any operational use case.
What industries is this most suited to? What industries do you focus on?
The Transpara platform isn't custom-built for a specific industry. In fact, it can be used in any industry or horizontal. Since our background and history center around process industries, the Transpara platform comes with a rigor, speed, and scale required by high-safety environments, but it can be used absolutely anywhere.
Transpara's design allows for easy implementation in any industry. We work with a wide range of companies across a variety of industries, including but not limited to:
- Energy & Utilities
- Oil & Gas
- Manufacturing
- Mining
- Pharma & Biotech
- Telecommunications
- IT Cloud & Data
- Food & Beverage
- Water & Wastewater
- Facilities & Building Management
- Core Infrastructure / Smart Cities
If I implement Transpara at one site, how easy is it to expand to additional
Very. Transapara is designed for rapid and repeatable implementation. Many of our customers have expanded into global rollouts with 25 or more sites
Do you have a library of KPIs for my industry?
Yes, we have sample P' only at an industry level, but also at sub-industry, role-based and use case-based levels
What are examples of your largest deployments?
How do you define “largest?” We define it in a number of ways at Transpara. Our “largest” deployments have been defined in terms of:
- Number of KPIs
- Data frequency
- Number of sites
- Data sources
- Number of instances or tenants
Some examples? With regards to KPIs, we had one client whose deployment involved around 550,000 KPIs centered on IT infrastructure and monitoring. In terms of data frequency, another customer's deployment involved 1000 sensors with about 2M inserts per second in total. One corporate client deployed to 26 sites, and another's deployment involved 45 radically different apps. Finally, we had a customer whose deployment involved 25 different tenants on a single server. So, yes, we can handle the big ones
Using the Software Questions
Is it possible to add a logo, image, or text box label to the Dashboard?
You have the flexibility to add a wide range of items to your Dashboard, such as KPIs, charts, trends, embedded content from external sources, groups/hierarchies, and more. Additionally, you can personalize your Dashboard by including custom logos and other images. You can add labels, static text, and dynamic objects from data sources using Visual KPI Interfaces.
Here is a few examples:
- Show a safety message to all users (static, or pull a dynamic message from a data source).
- Show a dynamic text value, such as which batch is currently running or what product you are currently producing.
- Show a dynamic value, such as a price or temperature.
- Show a diagram, logo, or another custom image in a resizeable widget anywhere on the dashboard.
Refer to the pages below to learn more about the content of this page:
Is Dashboard to Dashboard navigation possible?
Not at this time. Visual KPI Groups are designed to have one active Dashboard per Group, with the exception of the Home group, which already has this Dashboard feature available.
We are developing a feature that will enable seamless navigation between Dashboards, similar to Group to Group navigation.
Learn more about Visual KPI Groups.
When using Chrome on a touchscreen, why can't I drag trends in Visual KPI using a cursor?
Google Chrome automatically enables touch events on touch-enabled devices. This means Chrome will override the mouse (or touchpad) for some types of events. If you are using Google Chrome on a touchscreen device and cannot see the cursor, you may need to disable touch events.
To use the cursor (and a mouse or touchpad) on your Visual KPI site so you can drag it for things like box zoom on a trend, disable Touch Events or Touch API (depending on your version of Chrome), do the following:
- Open Google Chrome.
- In the URL address bar type
chrome://flags/and press Enter. - Click Enable touch events > Disabled.
On iOS, you won’t see a cursor, but you can use Visual KPI draw/drag tools when you disable drag and drop. To perform this, do these steps:
- Open Google Chrome.
- In the URL address bar type
chrome://flags/and press Enter. - Set Drag and Drop to Disabled.
You may need to relaunch your browser for the new setting to take effect.
Can I print or save to PDF my dashboards/reports?
Yes, it's possible to print and save your dashboards and reports from Visual KPI in PDF format. This can be done easily by using third-party tools like HTML TO PDF Converter. These tools are capable of converting complex HTML pages, such as those in Visual KPI, into properly formatted PDF files. Printing or saving to PDF directly from your web browser often results in unprofessional formatting. To avoid this issue, use HTML to PDF conversion softwares instead.
Make sure to test different settings, such as Delay before conversion to allow the page to fully load before converting.
What is Transpara's definition of a KPI?
There are a lot of academic definitions out there, but ours is crazy simple, we define a KPI as anything you care enough to track that has some form of expected behavior.
Why is how Transpara defines a KPI so important?
In our approach, a KPI is what gives everything color or status and ability to alert. When a KPI crosses a threshold in Transpara, it can raise its hand to alert or engage a user and automatically build visualizations.
How does this compare to how other applications like BI tools and reporting software to visualize information?
In a BI solution, you have to say 'I want a pie chart there.' There's no forced consistency around the concept of 'status.'
And while BI lets you make KPIs, you might make two right next to each other that could never be summarized. With BI, there's no way for the solution to look at everything and assess— it doesn't become a system, and you're left with only pieces and parts assembled.
With Transpara, the solution works without us (or our software) having to know what data is in there at all or where it comes from. Transpara's unique approach relies on a consistent pattern in how KPIs are defined, regardless of where the data comes from, how fast it moves, or how seemingly unrelated it's. KPIs are organized for end-user navigation with automatic roll-ups that show what's happening at any level of your hierarchy. These exception-based, at-a-glance views increase the speed of identifying problems or opportunities, while requiring less cognitive load from your users to find what they need. When compared to a BI tool or reporting software, Transpara allows you to much more easily visualize large volumes of data and KPIs at-a-glance and quickly find what needs your attention with intuitive filtering, sorting, grouping, and search – functioning more like the commercial apps you use every day such as Amazon, Zillow, and others.
Is Transpara self-service?
Yes. Transpara is so simple to use that most customers don't need any assistance at all once they are set up. First off, most apps in our space design their UIs based on other apps in the space— we go out of our way to base our UI on the consumer apps users are already familiar with. We work for power users and regular end users alike, too. If you're a power user, great, create your own KPIs. If you're a more traditional end user, think of Transapara as 'non-destructive.' We have visualizations already in place so you can choose and refine as needed without changing the system or the view.
Do I need a full-time person to manage/administer Visual KPI?
None of our customers has a full-time manager or admin in place. We may spend some initial time with you setting things up— after that, there are typically just small maintenance bits that may come up. You will have direct access to Transpara's support experts from initial deployment through to ongoing, proactive support.
Can anyone create their own dashboards? Their own visualizations?
Yes, anyone can make dashboards. Admin can also lock them down, too, so that users can view but not edit dashboards, or secure them against specific users. If a user does want to edit one, they can make a copy and run edits.And, yes, you can take on visualizations, too, then filter, group, or sort those visualizations by different attributes. Again, Transapara is non-destructive, so you can do all of that without "breaking" the system or view.
QuickStart Pilot Questions
How quickly can you spin up a pilot?
We can spin up a pilot in less than four weeks. A normal pilot is up and running in a matter of days. We focused on making Transpara productized, not projectware, so it doesn't require a ton of IT work. Transpara doesn't have six-month evaluations, consultants, etc., so you can spend more time thinking about what you really care about.
How long does a pilot normally last?
With our Quickstart Program, you'll get a 60-day license key to ensure fit. During the entire time frame, we support you as a full-blown customer.
How quickly can you convert the pilot into a full system deployment?
That will depend on the specific scope of your project. Deployments with Transpara are typically fast. Keep in mind that almost 100% of pilots end up being full systems, so we're good at it.
What are the requirements for a pilot?
It comes down to time and access on your part. With those two ingredients we can typically get your pilot running in two weeks.
What support do you provide during a pilot?
During the first 14 days of the pilot, we work with you to determine criteria of success, establish data source connections, create KPIs and configure dashboards. We also conduct customer discovery to identify objectives for the pilot, then develop a comprehensive solution. Over the next few weeks, we offer ongoing training and support, including tutorials, webinars, and customer support to ensure your team can fully utilize the software and achieve desired results.
Who on our side needs to be involved in scoping a pilot or setting up the system?
Anyone you want involved, really. You will need:
- Someone from IT to set up the server.
- Someone with the right access to data sources and an understanding of the data itself.
- Someone with authority to act on server.
- Someone from management or the C-suite.
What is the normal cost of a pilot and what is included?
It depends on scope and your criteria for success, but it usually ranges from 15k to 45k.
Support & Services Questions
What services do you offer? Do I need them? (consulting, training, etc.)
We offer all kinds of services. The truth is 95% of our customers don't require technical consulting and can get by with just our proactive product support. We also offer free online training and paid, custom training, as well as consulting for deep product and industry experts. We've partners who can do all the other forms of consultancy, system integration, etc., if required.
How often do you release new features and functionality (including fixes)? Do I need to upgrade the system each time? How easy is it to upgrade to a new version (downtime, resources required, etc)?
We do approximately 20 to 40 releases per year, but there's no need for you to upgrade at the same pace we release software. Our existing customers take a range of approaches, from upgrading every time to not upgrading for years, but it averages out at roughly every quarter to every 6 months. Upgrading takes just minutes and is backwards compatible.
How can we contact you for product support? What hours, and what is your normal response time?
You can contact us anytime at our Support. Our turnaround times are fast. We also maintain an online Knowledge Base and Training content.
Do you have a support SLA?
We've multiple tiers of support, with more aggressive SLAs at each tier. Contact us for more details.
Company Background, History & Expertise Questions
Why is Transpara the right company to be doing this? What is your background?
We've deep software and industrial backgrounds, with team members coming from the likes of Microsoft, OSIsoft, Honeywell, Accenture, and Aspen Tech. This is the third software company we've created, and we've a particular passion for productized solutions. With 500+ public releases under our belts, you get to benefit from all that rigor, even if you're not using Transpara in a hardcore, industrial environment.
How big is Transpara? Where do you have staff?
We're a small but highly active group of contrarians who've been building and releasing industrial-strength enterprise software products for decades. We've thousands of releases under our belts, hundreds of happy customers across more than 25 countries, and the battle scars to prove it.
What are my next steps?
You can move forward in a number of ways. Try these out:
- Take the training
- Check out our website
- Schedule a live demo and Q&A
- Engage us for a Quickstart pilot.