Overview
The Visual KPI Designer is a tool for creators and administrators responsible for setting up, configuring, and managing the Visual KPI website's back end. It is a configuration hub that links data sources, defines KPIs, and organizes the data hierarchical structure.
Using the Visual KPI Designer, you can manipulate and prepare the data presentation without directly interacting with the end-user interface of the Visual KPI website. On the other hand, the Visual KPI site is the front-end interface accessed by end users, displaying the data visualizations configured in the Visual KPI Designer.
How to use the Visual KPI Designer
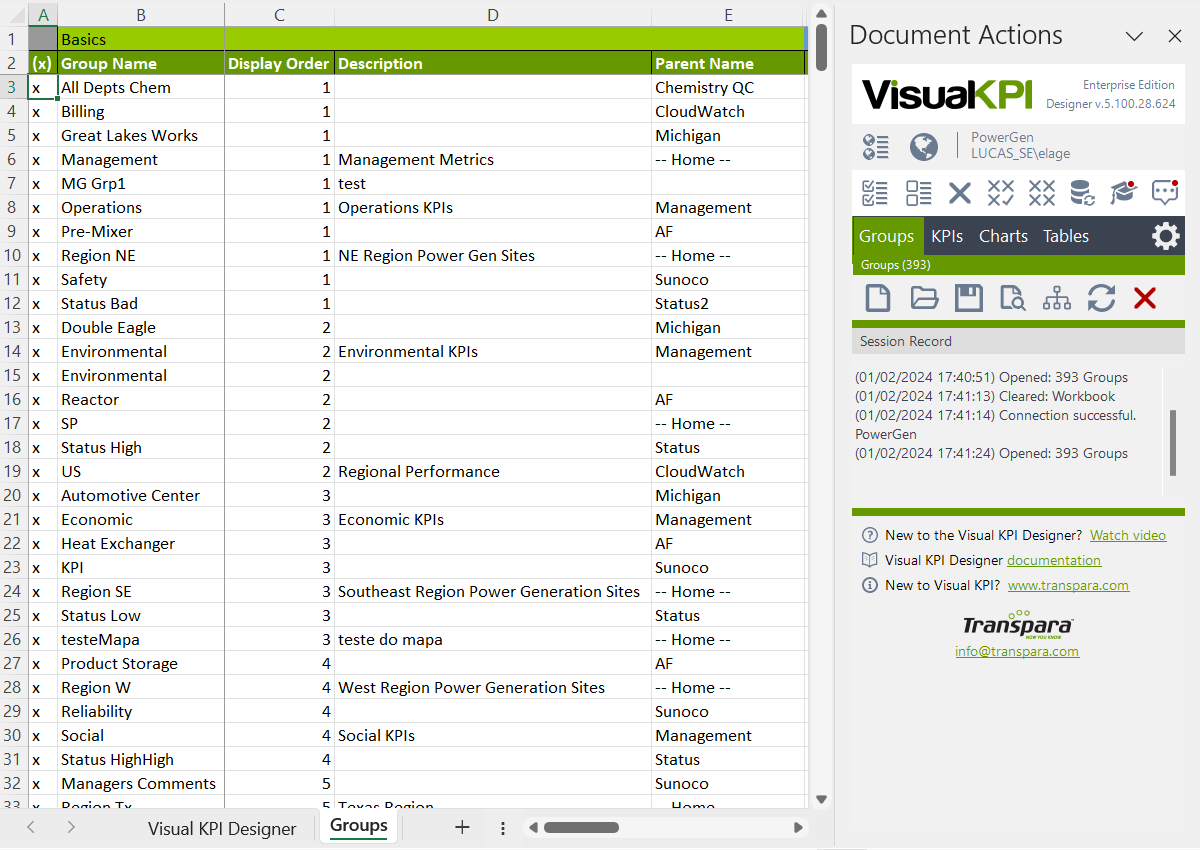
The Visual KPI Designer is an add-on tool for Microsoft Excel. You use the traditional Excel interface to set up and manage Visual KPI websites. The Visual KPI Designer is compatible with Excel versions from 2007, though it works best with versions 2013 or 2016.

The Visual KPI website doesn't immediately update changes or input data users make in Excel on the Designer. Instead, the data is saved within Excel and manually uploaded to the Visual KPI server when the user is ready. This approach ensures that any in-progress changes don't disrupt the ongoing operations of the Visual KPI site, allowing for uninterrupted access and analysis of real-time data.
At its core, the Visual KPI Designer doesn't create or store the operational data. It is more about organizing and presenting the data. Users can set up how they want their data to be displayed on their Visual KPI site, like showing sales figures in a specific format or for a particular time frame.
What's Next?
Start your journey to become a pro in Visual KPI Designer from the first step by installing it.
You can also explore the Settings and Authoring contents.
If you want to improve further, enroll in our Designer Training Course and dive deep into it.