Best Practices
Following best practices in Visual KPI Designer is all about creating a reliable, user-friendly experience. When settings are configured thoughtfully, end users see accurate, timely data and receive alerts that matter—without unnecessary noise. Setting things up with care ensures the dashboard performs smoothly, delivering the insights users need without friction.
Most of these configurations will only be done once, but might impact the experience of your Visual KPI website users daily.
The best practices outlined here are:
Configurations
The standard configurations were set up by Transpara's team, as the ones that most clients use or are interested in. You will likely not need to change most of the available configurations. However, there are some configurations that most people don't change, but changing them makes the Visual KPI website look more polished.
Site Icon
You can add your company's icon to be displayed on the Visual KPI website. You can add different icons for light and dark themes. To change the logo, click on the Transpara logo on the Visual KPI Designer sidebar.
If you don't have your company's logo in the correct size (140x40 pixels), you can email support@transpara.com with your high resolution logo and ask us to make a version for light and dark themes. Our teams will create a file that is the right size and will look great on the Visual KPI website.
Website Name
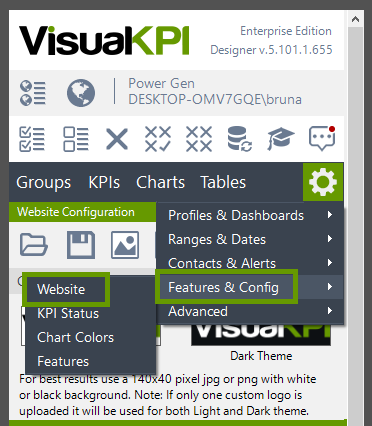
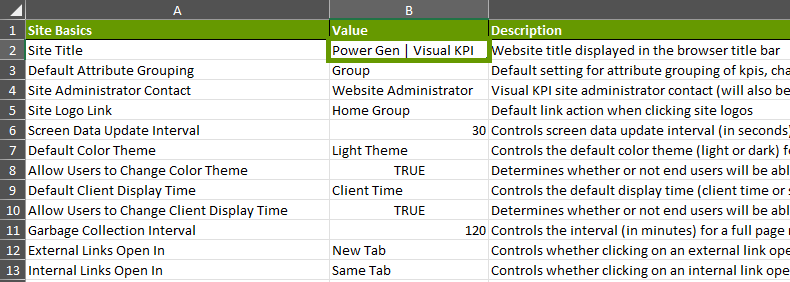
You can change the name on the browser tab to your company's or the location's name. To do so, go to the Site Settings icon (![]() ), select Features & Config, and then Website. In the Site Basics section, in the Site Title line, alter the text in the Value column. To learn more about these settings, go to the Features & Configuration guide.
), select Features & Config, and then Website. In the Site Basics section, in the Site Title line, alter the text in the Value column. To learn more about these settings, go to the Features & Configuration guide.
Default Theme
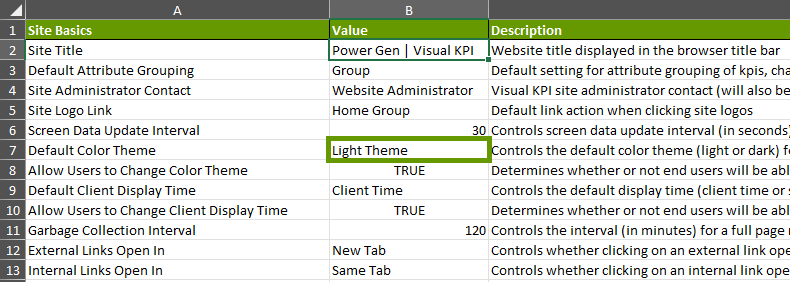
The light theme is the standard for every new instance of Visual KPI. However, you can set up the dark theme as the default for your website by selecting it in the Default Color Theme line on the Value column. You can also change whether users can change the theme for themselves in the Allow Users to Change Color Theme line.
Alerts
We recommend setting up contacts and defining alert templates that suit your organization's needs. When doing so, consider that not all status changes need alerts, and setting up alerts for everything might overwhelm the contacts with messages. For more detailed information on this feature, go to the Contacts & Alerts guide.
Stale Age
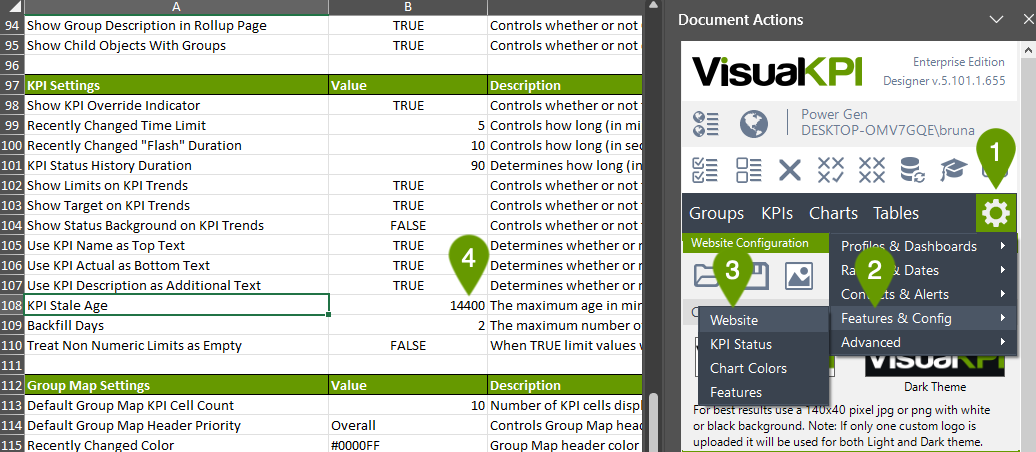
The Stale Age is a certain amount of time, after which the KPI will show in orange. That means that the data in that KPI was received a while ago, so that information might not be as relevant anymore, or the data source might be disconnected.
The Stale Age default configuration is 14400 minutes (10 days), but you should set it up so it matches your situation. If you receive data every hour, for example, you might want to set your stale age to a few hours. If you have many KPIs that constantly go stale, consider reviewing your stale age limit.
Consider setting up an alert for your admin about stale KPIs so that they can check if everything is working as expected or if there is a need to fix some data input or examine that KPI's source.
To alter the Stale Age sitewide configuration, click on the Site Settings icon (![]() ), go to Features & Config, select Website settings, scroll to the KPI Settings section and change the number in the Value column. This number should be in minutes and if you leave it as 0 (zero), the website will ignore the Stale status. This feature can be overridden by group or individual KPI's settings.
), go to Features & Config, select Website settings, scroll to the KPI Settings section and change the number in the Value column. This number should be in minutes and if you leave it as 0 (zero), the website will ignore the Stale status. This feature can be overridden by group or individual KPI's settings.
Languages
Language settings are sitewide. You set the language in the Visual KPI Designer, and everyone who accesses that instance of Visual KPI will see the site with that language setting. You should also note that changing the language settings will only change the site's language, not your data's. For example, if you have a group of KPIs called "Management", and you change the site's language to Spanish, that group will still be called "Management". You can read more on the Language guide.
Naming
Whenever naming anything in Visual KPI, you should always pay attention to two essential practices that will improve end-user experience:
- Use short names: Long names might take several lines or not be shown completely, especially for mobile users.
- Use unique names: If you have many things named basically the same, make sure to put the unique part of their names first.
For example, suppose your company has two turbines in three areas, and you need a KPI for each of their internal temperatures. In that case, we recommend naming it "A2 T1 Internal Temperature" instead of "Internal Temperature of Turbine 1 Area 2". That way, if the name is truncated in any part of the website, the user can still quickly identify which turbine that KPI is referring to.
You can use the Description column to add the entire name of the KPI. Once all the information is in the Description column, a user searching for it can find it by either the name or the description.
When users search for something, they find results matching both the Name and Description columns. In the example above, the user could find the desired KPI by searching "A2 T1" or "Turbine 1 Area 2".
Units of Measure (UoM)
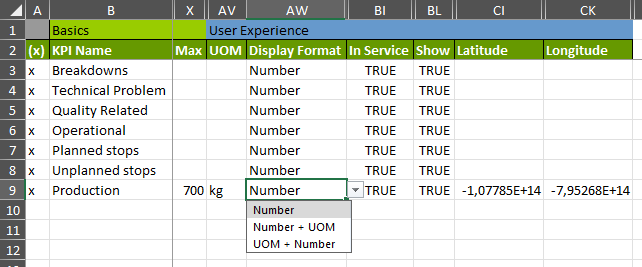
We recommend that you inform the Unit of Measure (UoM) of all possible objects whenever possible. This can help avoid confusion and make the understanding of any KPI faster. For example, if you have a temperature KPI, it should always say whether that temperature is in Celcius or Fahrenheit. To inform a UoM, scroll to the UOM column and inform the unit. You can also then select the Display Format. It can be just the number, first the number and then the UOM, or first the UOM and then the number.
