Browser
To start using Visual KPI, access the URL provided by your admin. The website's landing page is the Dashboard, and you can return to it anytime by clicking on the Dashboard icon or the Visual KPI icon. You can customize this page to display the KPIs most helpful to your daily operation. You can perform the customization or ask the Designer to do it.
Main sidebar
On the left sidebar, you will find icons to access Visual KPI's main functionalities. Apart from the ones described below, there are also the Share and Help icons.
Groups
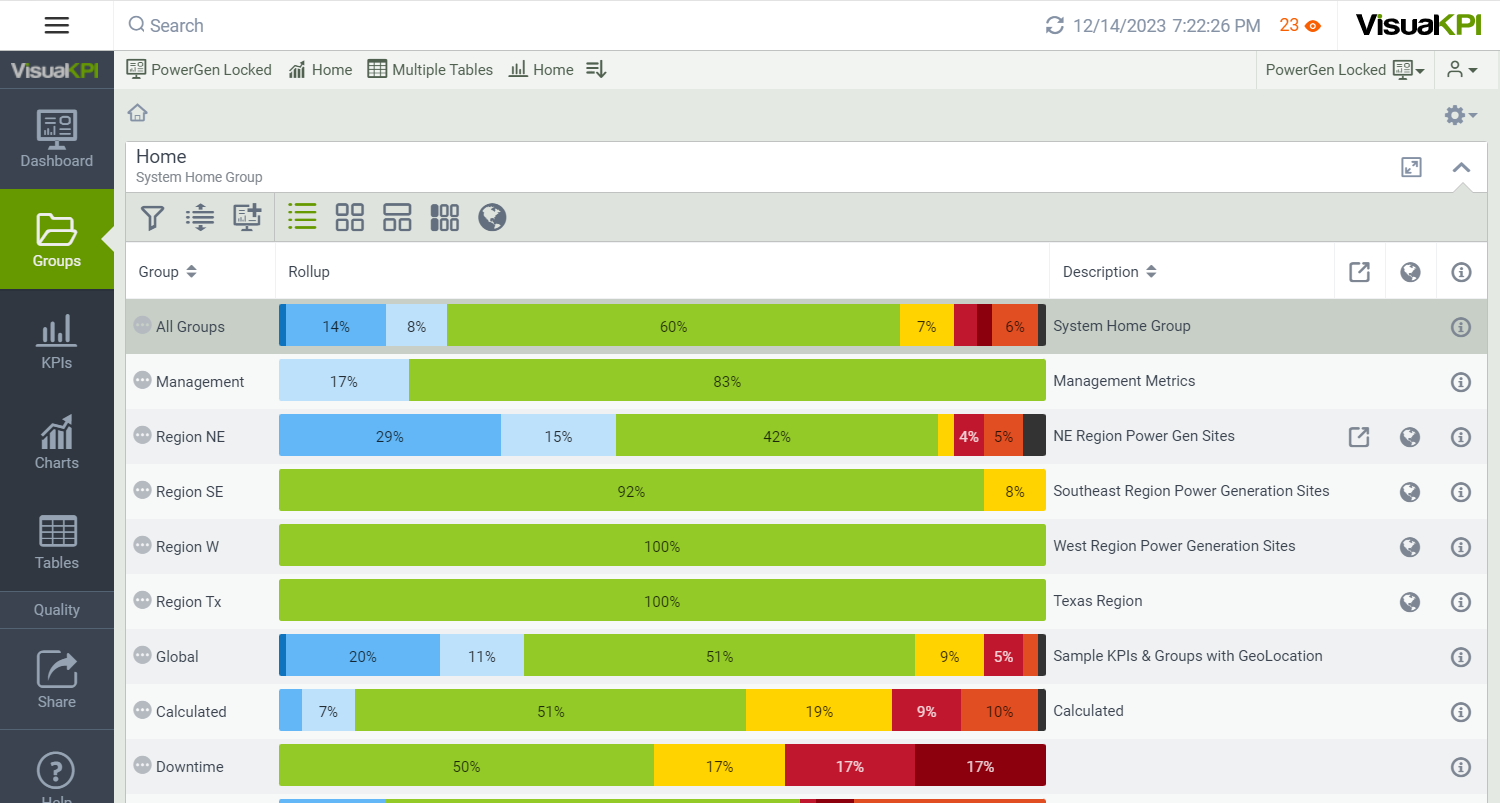
The group section is like a PC folder, which can contain other groups, KPIs, Charts, and Tables in the same visualization.
KPIs
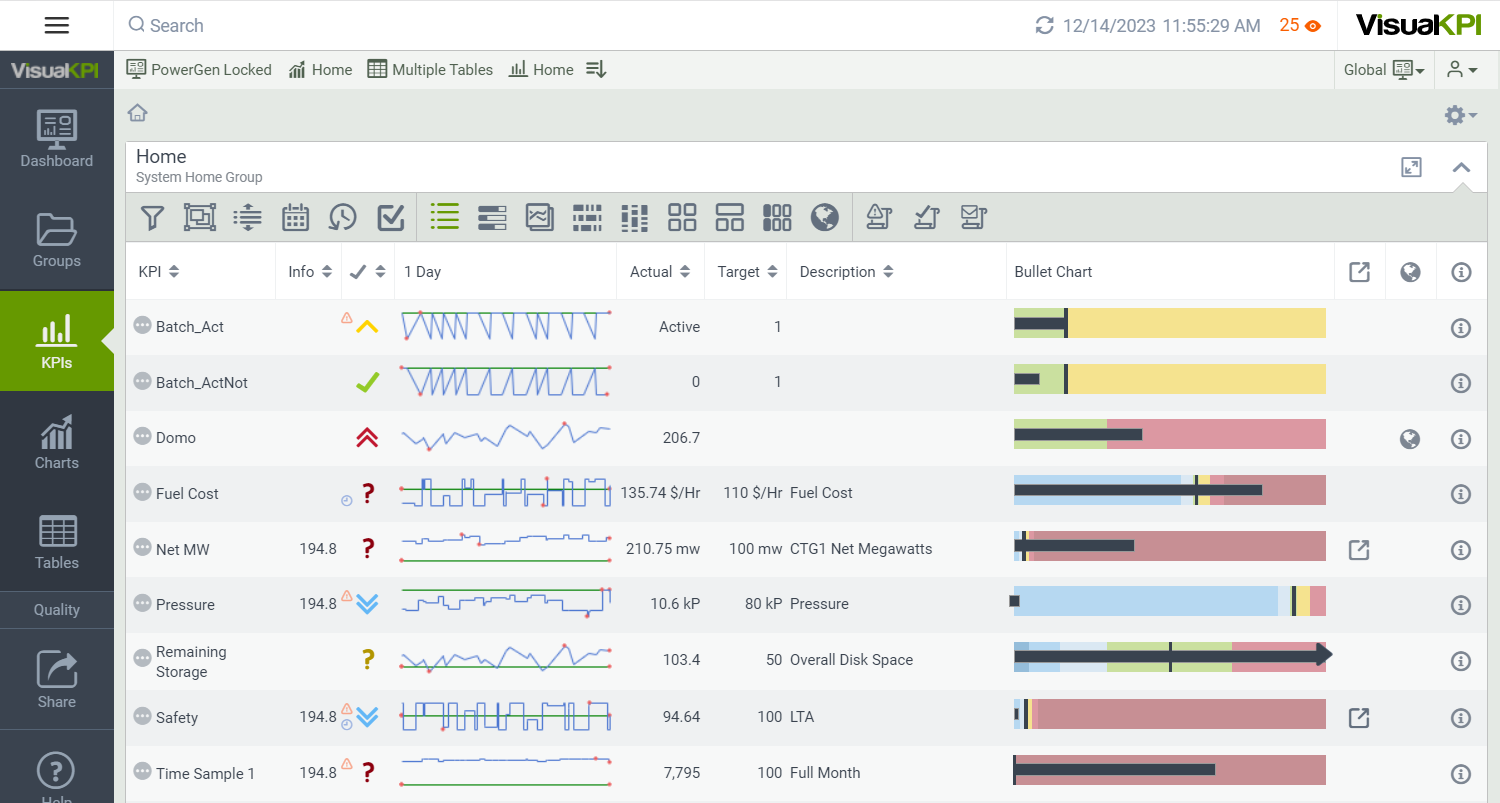
When you select the KPIs icon, Visual KPI presents a list of your KPIs. You can sort them by clicking the arrows beside each header. The default is the list view, but you can change it by clicking on the icons on the bar above the KPIs. Click on any KPI to see all the detailed information regarding that KPI.
Charts
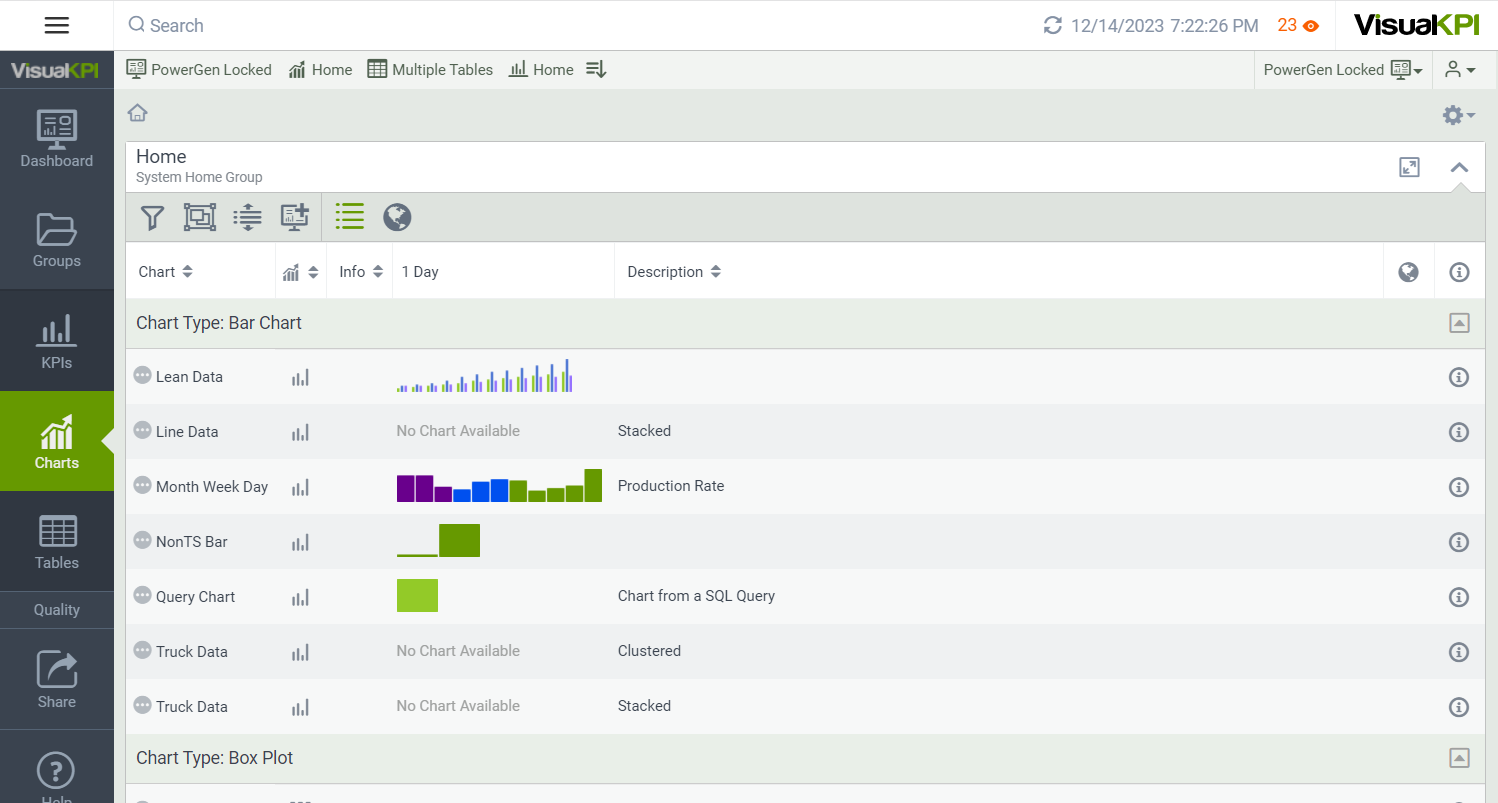
Select the Charts icon to visualize your data and open any Chart in the list to see its details in the data panel.
Tables
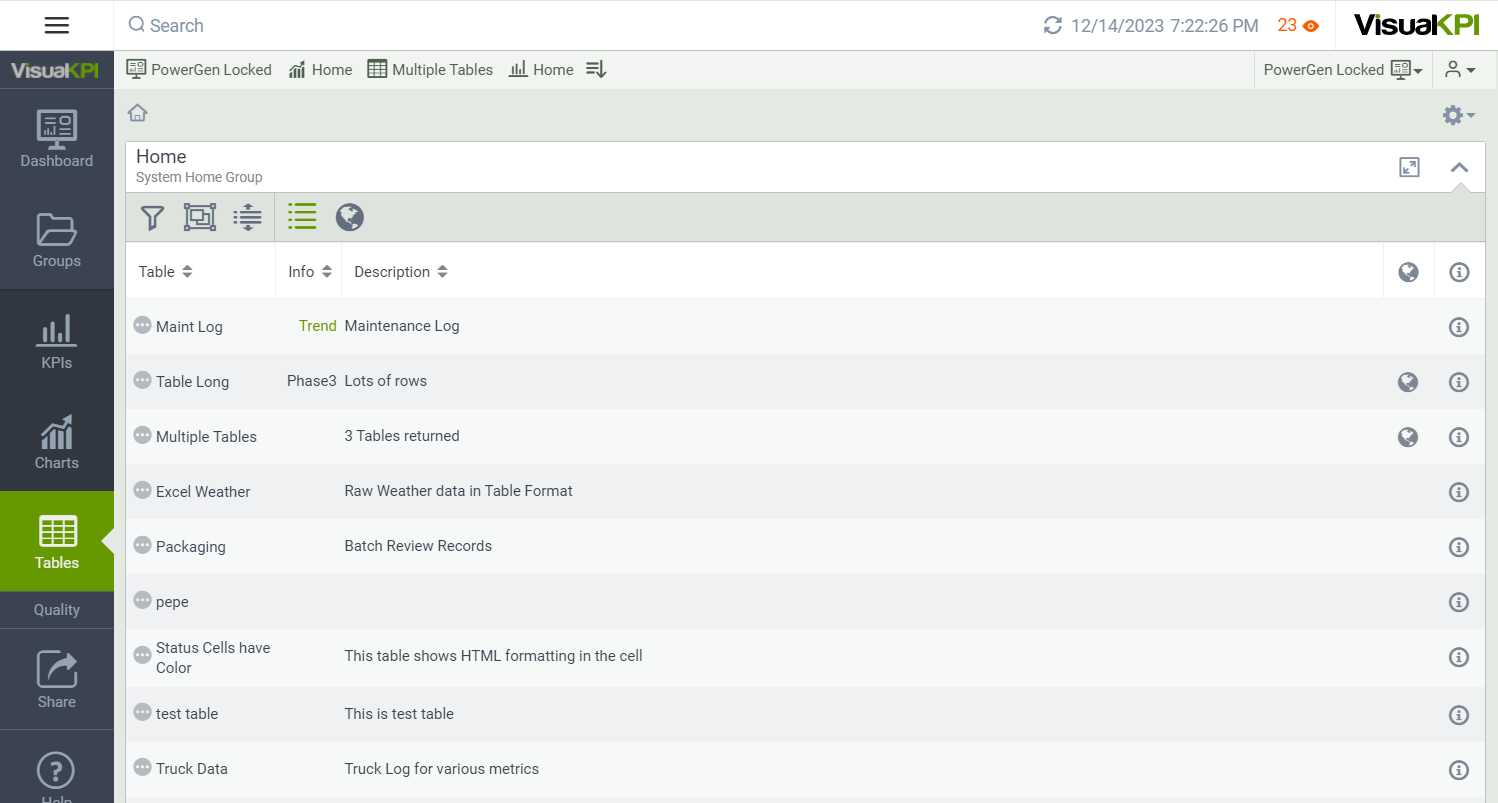
You can access all the Tables related to your Groups, an optional configuration on the Tables icon. With Tables, you can set maintenance logs, shift reports, error lists, or other relevant tabular data to your Groups.
Quick start tools
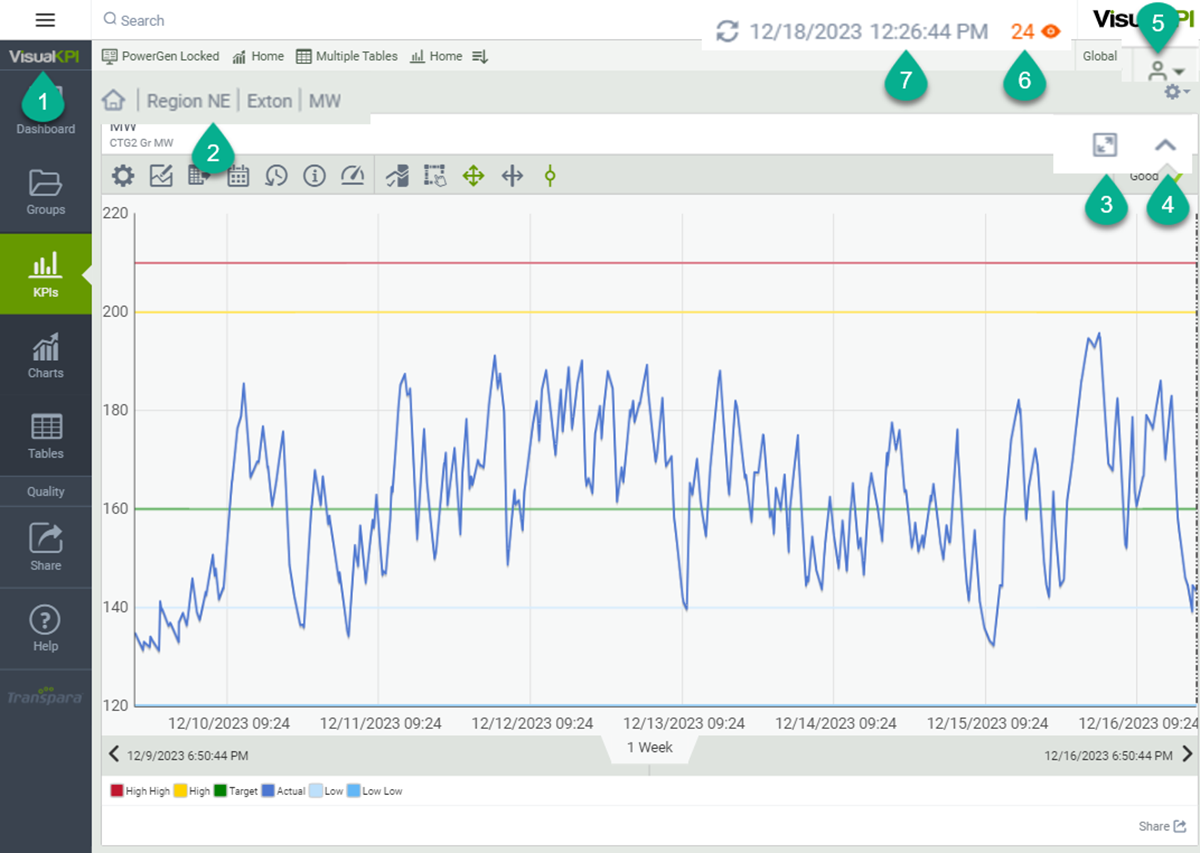
The quick start tools enhance your navigation experience by simplifying your interaction. They provide shortcuts to frequently used actions. Below is a list of the available options.
- Home icon: Click the Home icon to return to the top level of the current Group.
- Breadcrumbs: Breadcrumbs show you where you are in the Group or object hierarchy as you navigate Visual KPI. You can click on each level to go to that specific page.
- Expand and collapse KPI full screen: Use the full-screen icon to hide the Visual KPI navigation bar and make your KPI or list full screen. When you want to return to the standard view, click the icon again to return to the standard screen.
- Hide and show menu: The Hide Menu icon collapses the tools menu above groups and objects, while the Show Menu icon shows the tools menu.
- Profiles: Click the Profile icon under your company logo to see the profiles shared with you. You can create as many as you like, creating a custom view for different access levels, such as Plant Manager, Supervisor, and Operator.
- Watchlist: Your Watchlist appears in the top bar of your Visual KPI site as a number with an eye icon. You add KPIs to your Watchlist like you add favorites to your bookmarks bar in your browser so the Visual KPI can track the KPIs and alert you when any of those are in alert condition. The number tells you how many of your watched items are in alert condition.
- Timestamp: The last time the KPIs were updated.
What's next?
Access the Responsive page to learn the capabilities and benefits of responsive Visual KPI software.