KPI
KPI stands for Key Performance Indicator, a measurable amount organizations use to evaluate their success in achieving specific business objectives. Simply put, it refers to something considered important enough to monitor, which should behave as expected. These KPIs, such as Key Metrics and Performance Indicators, are closely related to performance analysis. Each KPI is associated with specific data used to evaluate and measure various metrics that provide insights into multiple aspects of business performance.
How KPIs work
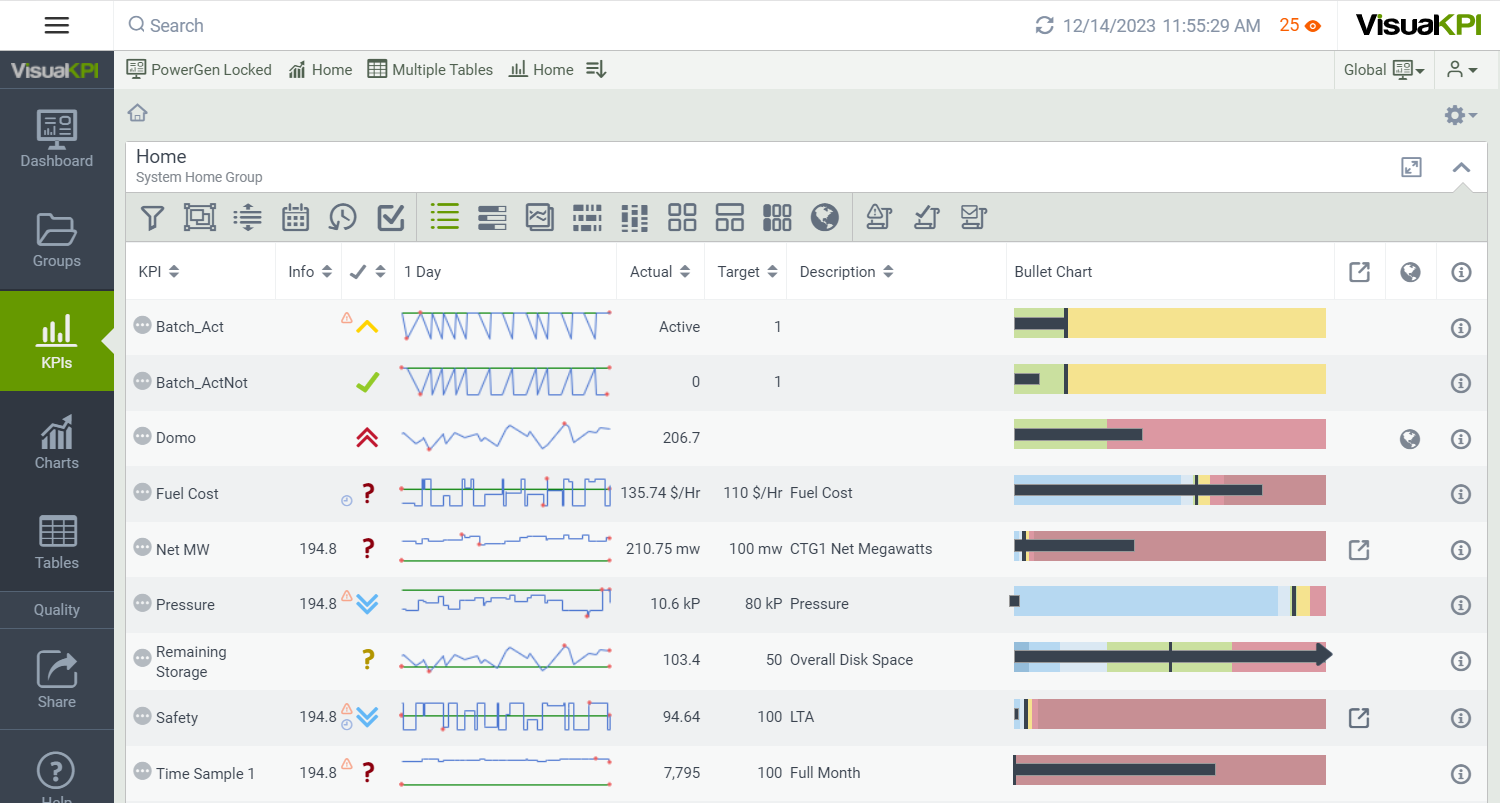
Visual KPI, as a software tool, works by visually representing these KPIs in an easily understandable and accessible format. It collects data from diverse sources such as databases, applications, or other systems and then displays this information through intuitive visualizations like charts, graphs, or dashboards. These metrics include financial data, operational statistics, customer feedback, and more.
KPIs can represent information from any data source. You can monitor and analyze digital, analog, and ENUM variables.
Visual KPI uses color-coding to represent KPIs' status, making it easier for users to quickly assess performance against expected standards.

These indicators serve as a core element of the user experience, providing visual and meaningful insights into an organization's performance. Visual KPI is an assertive tool for organizations that provides a comprehensive and visually engaging representation of key metrics based on real-time data.
What's next?
Now that you know more about KPIs, learn more about how to use Visual KPI with the Browser guide.