Core Concepts
Visual KPI Server can connect with and retrieve data from almost any data source by interfacing with them. Visual KPI can import specific portions of the source data by connecting to different databases or third-party platforms. This page provides you with the necessary information to understand the basics of Visual KPI Interfaces.
Interfaces
A Visual KPI interface is an essential component that functions as a data connector between external databases and the Visual KPI server. Interfaces retrieve data from external systems in a read-only, lightweight manner, ensuring the original data remains intact.
An interface specifies the type of technology used to communicate with a system, such as OLAP, JSON, or SQL. It also includes login credentials to access the database and the queries required to extract data. The interface establishes a connection to a database using a URL and specifies event logging levels, as well as regional and time zone settings.
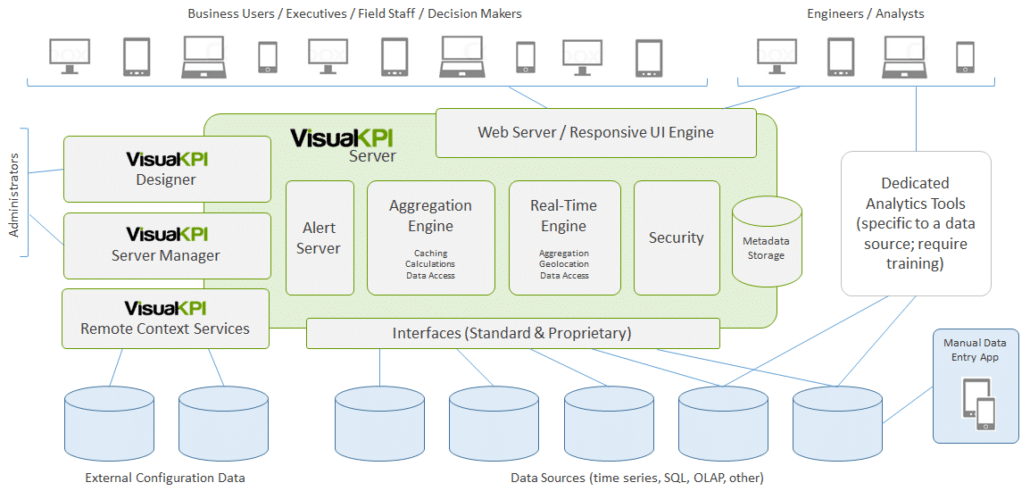
The image below illustrates the architecture of different components of Visual KPI and their interactions:

Once an interface is created, you should never have to go back to it for maintenance (except when upgrading to a newer version of Visual KPI).
Visual KPI Interface Components
The Visual KPI interface is composed of three fundamental elements:
- Connection to the data source: Specifies how to establish a connection to the data.
- Queries: Define what information can be requested from the data and what the system should expect to receive in response.
- Security: The authentication information to access the data, which ensures that only authorized users can access the data.
Visual KPI offers pre-packaged interfaces that include all components and can be configured using a wizard without the need for queries.
Connection
When connecting to a data source, the way you connect is determined by the connection string if the source is SQL-based, or URLs if it is JSON/Odata/XML/Web services. You need to specify the internet address of the database you're connecting to, as well as any specific database time zone or date-time format. Finally, you need to specify the local location where the data will reside so that the Visual KPI server can use it.
Queries
This part of the interface allows for up to four data queries to be specified for data retrieval:
- Current value: the most recent or current value in the database.
- Historical value: A specific value within a timestamp in the past will be returned by the query. If no value is found for the specified time, the data with the nearest earlier timestamp will be returned.
- Trend data: Consists of a sequence of data that falls between two different timestamps. To ensure that the trend line appears smoother at both ends, the data for the data point preceding the beginning of the trend and the data point following the end of the trend are also collected.
- Historical data: In cases where a more detailed analysis of data is required and all data points are needed instead of less detailed running averages, the option to collect and analyze all data points may be necessary. For instance, data may be collected every second, but for visualization purposes, a less detailed average of every 10 seconds may be calculated.
Security
An interface must be configured with security credentials to access databases. Follow best practices to ensure the interface remains viable and data access is maintained:
- Avoid using work groups: Instead, use Windows domain authentication whenever possible, especially in a corporate scenario. Using work groups adds to the number of identities that need to be managed, which can lead to complications. It is recommended to set up Local groups in Active Directory or in a security group on the Web server for better management.
- Avoid using IP addresses: Whenever possible, use DNS or FQDN names. IP addresses are prone to change, while domain names can be altered easily without affecting each interface.
- Never use an individual user account for authentication: If an individual leaves the organization, their account removal will disable the interface. Additionally, changing passwords every few months can be a maintenance burden.
- Use a service account with network service: This requires permission on the remote server as domain\webservername$. A custom service account will also require permissions and service rights.
- Group-managed service account: This is ideal because it allows central management of rights and access.
From Data to KPI Visualizations
Visual KPI's interfaces component enables you to establish a data connection for each KPI to various data sources. With the interface, you can specify the data you want without worrying about how it is presented. Visual KPI takes care of the data expression through visualizations.
With the help of the Visual KPI Designer, an administrator can determine how the data will appear on the Visual KPI website. This feature enables you to establish data connections to several different database types, such as SQL, OLDB, Oracle, or database locations like Facility 1, Facility 2, or both. You can present them with the same visualizations, which allows you to combine data from various databases without having to create more complex data extracts or dumps.
Remote Context Service
In addition to interfaces, Visual KPI also has the concept of a Remote Context Service. An interface is used to retrieve raw data from a data source for visualizing KPIs, such as temperature, speed, price, or sales volume. On the other hand, Remote Context Service is designed to access configuration data or metadata from external sources. This configuration data includes information like group membership and hierarchy, KPI attributes such as targets and limits, geolocation, security information, and many other attributes.