Design and Authoring
In Visual KPI, Design and Authoring involves configuring vital components within the system. These components encompass Groups, KPIs, Charts, and Tables. Designing consists of configuring the KPIs, which information they show, and how they show them. Authoring means configuring Visual KPI's site and what each End User can access.
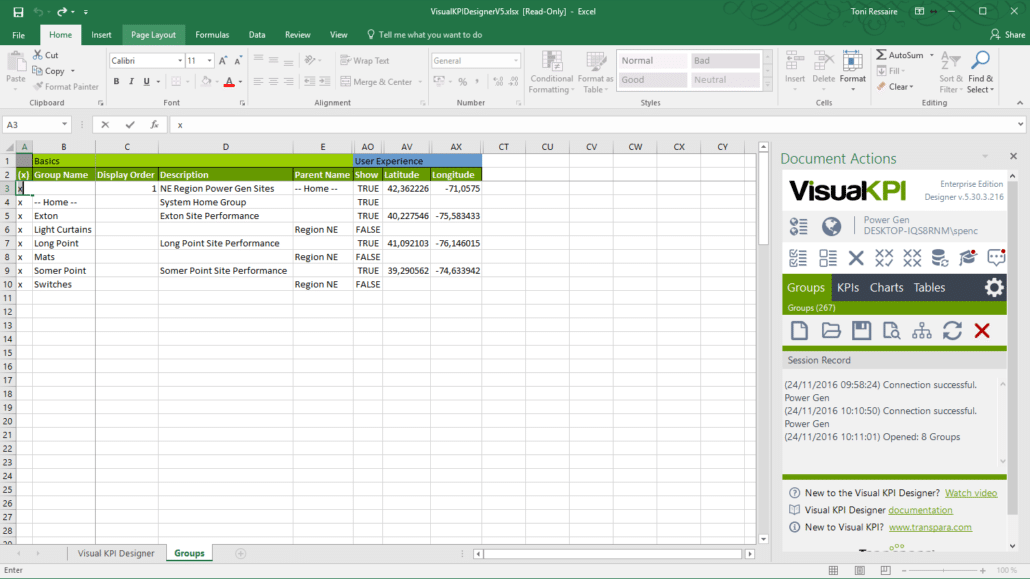
The Visual KPI Designer is the tool that helps with both these processes. It is an Excel add-in that offers versatility for various tasks, from prototypes to large-scale systems. Administrators wield the authority to manage links, ensuring streamlined user access to critical resources.
Visual KPI Designer integration
The Visual KPI Designer works inside Excel as an add-in for defining Visual KPI metadata or attributes. For this reason, you'll need to have version 2007 of Excel or newer when you install Visual KPI Designer. We recommend using Excel versions 2013 or 2016. See the system requirements and software prerequisites.

Configurable objects
Objects are all the components that can compose the graphical interface of Visual KPI. The design process is divided into distinct sections:
- Basics: Covers fundamental aspects like naming, descriptions, and grouping KPIs.
- User Experience: Involves customizing numeric formats and display settings to optimize the End User interface.
- SPC (Statistical Process Control): Addresses the incorporation of statistical analysis and control into the dashboard. Its feature allows users to monitor data quality and deviations from control limits. SPC is crucial for maintaining quality standards and identifying anomalies in real-time.
- Extended: Enables the addition of information columns, links, and parameters to enhance object functionality.
- Access Group List: Administrators can create, manage, and organize links for users, ensuring easy access to critical resources. Here, the Administrator can define the object-level security settings.
For more detailed guidance on utilizing the design and authoring features, you can refer to the Visual KPI documentation on Visual KPI Designer and take the Visual KPI Designer Training.
What's next?
The design process in Visual KPI allows for in-depth customization, ensuring that the system aligns with your organization's specific needs. Whether for rapid prototypes or large-scale production systems, Visual KPI Designer, the central configuration tool for Visual KPI, provides the necessary tools and features to configure a functional system. Access the Visual KPI Design to learn more about the functionalities available for Design and Authoring.