SQL Tutorial
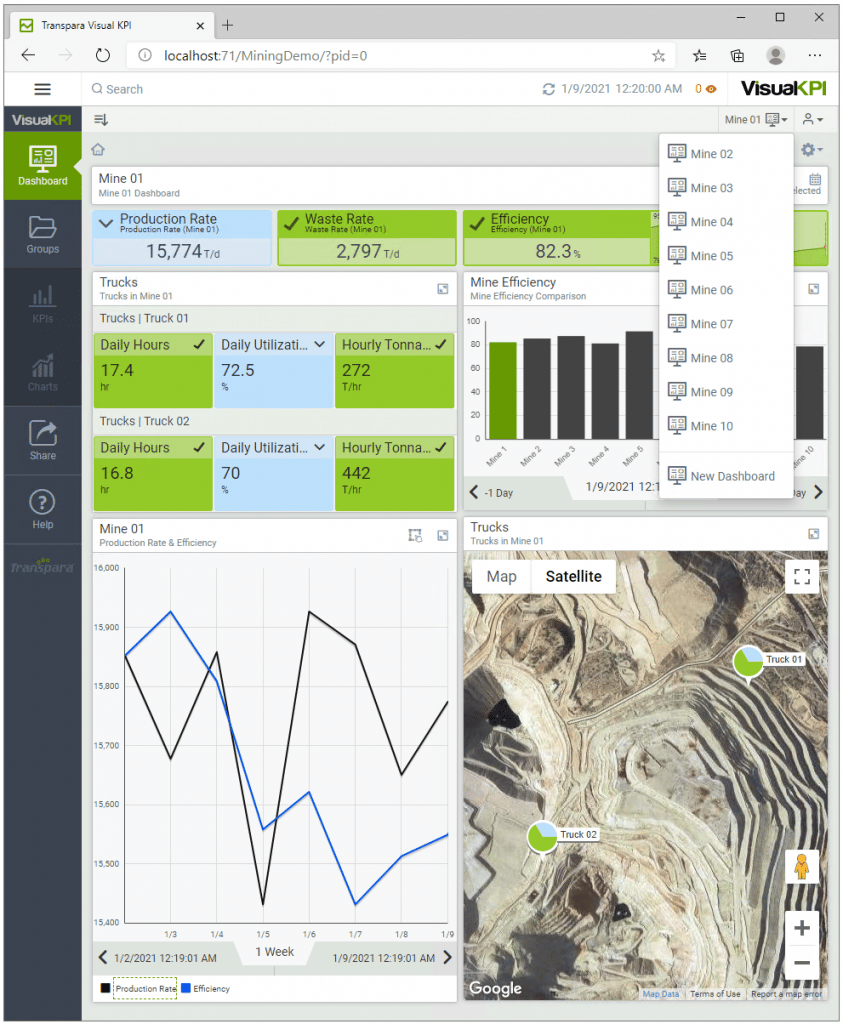
This tutorial will guide you through building a Visual KPI site to visualize data from a fictitious mining company using a custom SQL remote context server. The Visual KPI RCS will automate the creation of groups, KPIs, trends, bar charts, and dashboards.
The following steps will walk you through creating a working SQL remote context server and installing the sample data. You will get to add more data, visualizations, and dashboards. Then, you will be able to take a look at your data live on a Visual KPI site.
Prerequisites
What you will need before starting the tutorial:
- An installed version of Visual KPI Server Manager on a machine with all the prerequisites and required permissions.
- An installed version of Visual KPI Designer.
- Access (admin) to a SQL Server. This is necessary to create two databases. One of them is installed by the Server Manager for Visual KPI, while the other will be created manually and populated via a SQL script.
- The scripts required to follow this tutorial, found here: SQLRCSTutorialScripts.zip.
To install the most recent versions of Visual KPI software components, go to Transpara's download page.
Step 1: Install a new Visual KPI Instance
In this step, you will install a new instance of Visual KPI, configure it, and use it for the SQL remote context server demo.
To install a new instance, refer to the Install Visual KPI guide.
During installation, ensure that the Manufacturing Demo option is unchecked under Install prebuilt demos and sample data. This will prevent any unnecessary demo data from cluttering our Mining demo.
SQL security
For the web server to communicate with the SQL Server, SQL Security must be configured.
-
Single-box install (SQL and IIS on the same server): You need to grant permissions in order for Network Service (our default security context) to read and write to SQL.
-
Two-box deployment (separate IIS and SQL): You will have to grant these permissions to
<IISSERVER>$where<IISServer>is the name of the IIS Server. For example, ComputerA is our SQL Server and ComputerB is the name of our IIS server. We would need to grant privileges to ComputerB$, which is how Network Service is viewed across the network.
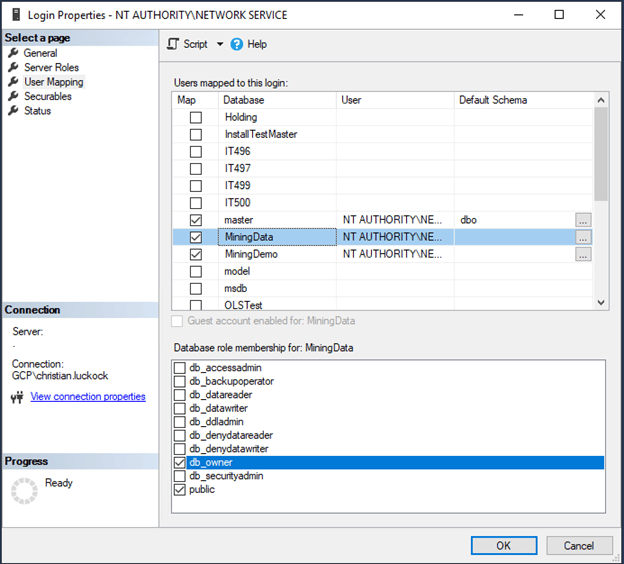
This tutorial has a single-box deployment, therefore you need to grant db_owner rights on the MiningDemo database (created by the Visual KPI Installation) to NT Authority\Network Service via SQL Server Management Studio.
Step 2: Configure Visual KPI Designer
In this step you need to configure Visual KPI Designer to work with SQL RCS. Once Visual KPI Designer is installed, you can add a new connection via the Instance Connection dialog.
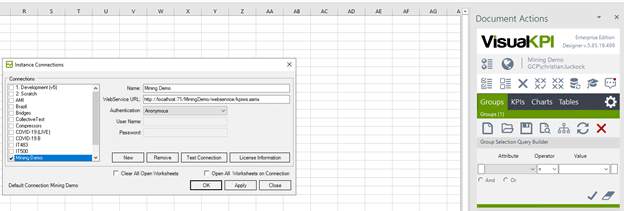
With everything installed and connected, you will need to create attributes and disable the stale age default setting. These processes are described below.
Create attributes
To begin, you need to create a list of attributes to use in the SQL RCS demo. Attributes are used for many things, including relationships of objects to groups, but for our demo we will be using them to view data by attributes (by Mine Type or Truck Model, etc).
For this tutorial, you will use Visual KPI Designer to add custom attributes. You can then populate the data for these attributes using the RCS. To add attributes in Visual KPI Designer, follow these steps:
-
Click on the Gear icon in the right panel of Visual KPI Designer.
-
Navigate to Advanced > Attributes.
-
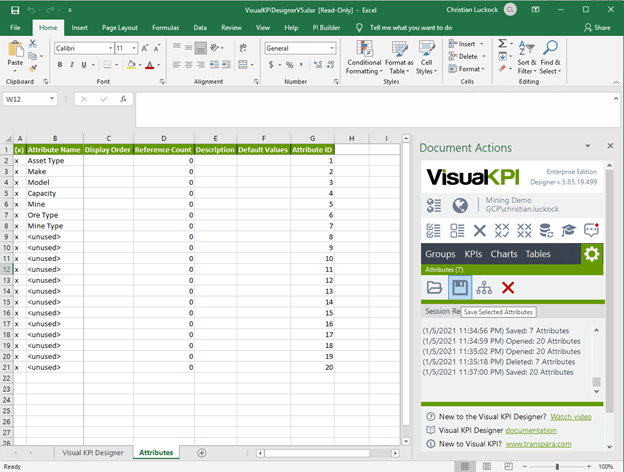
Add the following attributes:
- Asset Type
- Make
- Model
- Capacity
- Mine
- Ore Type
- Mine Type
-
Ensure the "x" is entered in the first column to select each attribute. This x signifies selection, as Visual KPI Designer actions such as Save and Delete are based on selected lines.
-
Click the Save icon to save these attributes back to the Visual KPI database.
The image below exemplifies how this should look like in Visual KPI Designer:
Disable the stale age default setting
To ensure accurate data representation on the KPI dashboard, it is recommended to modify the default setting for KPI Stale Age. The default setting is 60 minutes, which implies that when data retrieved via an Interface (such as truck or mine metrics) is older than an hour (timestamp), the KPI status will change to Stale. Therefore, it's advisable to adjust this setting to better suit your data requirements and ensure that the KPIs reflect the latest data.
In this demo, data can be either hourly or daily, and the concept of Stale should be ignored accordingly.
This setting can also be set as an override per individual KPI, but for our exercise it's easier to change the global setting.
To Disable the default setting, do the following:
- Click on the Gear icon in the right panel of Visual KPI Designer.
- Navigate to Features & Config > Website.
- Set the Value of KPI Stale Age to 0 (zero).
- Click the Save icon to save your changes.
This will turn off the feature.
Items under the gear icon aren't modifiable via the RCS at the time of this document's creation. We do plan to address this in a future build.
Step 3: Create a database for mining sample data
We recommended using SQL Server Management Studio to create a database for the mining demo data. The database should contain metadata, such as information about the mines, trucks, and their locations, and metric or process data, such as the amount mined per hour and truck utilization.
Create the Database
First, you need to create a database to hold this data. Follow the steps below:
- Open Microsoft SQL Server Management Studio.
- Right-click on the Databases folder and select New Database.
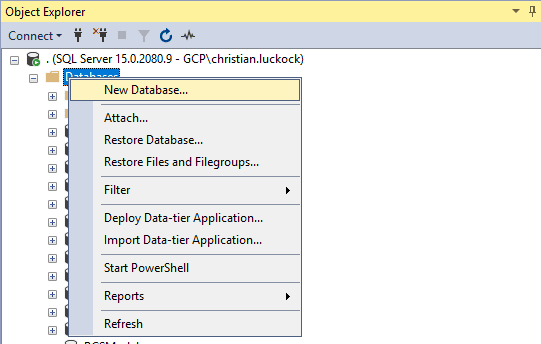
- Give the database a name. For example: MiningData.
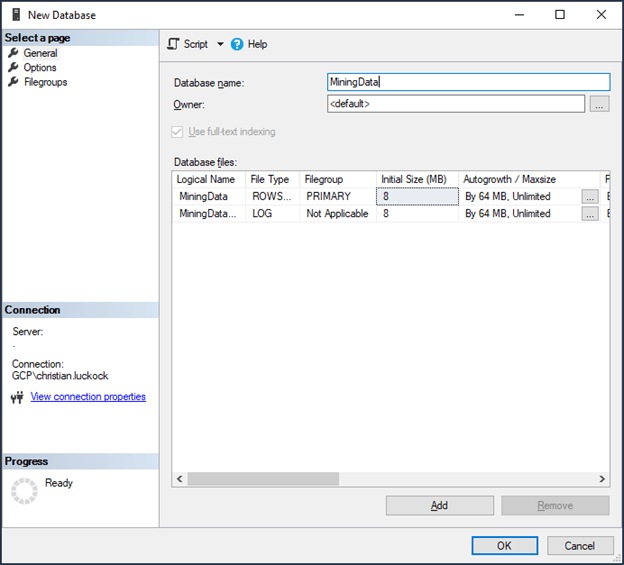
- Just like in Visual KPI database (MiningDemo), you need to allow Visual KPI access to the database. As described in Step 1, give Network Service or Boxname$ access to the database.
Execute the script to add data
Once the database is created, you need to add data to it. Here you will use the demoscript1.sql script downloaded earlier.
- Before running the script, make sure you are connected to the correct database, named MiningData.
- Open the demoscript1.sql script and execute the SQL. This script will create a year of fake data, so it will take about 20 seconds to complete.
When the scripts is done, you will find three tables (Metrics, Mines and Trucks), along with a handful of stored procedures.
Step 4: Install an ODBC Interface
To prepare for creating the RCS and KPIs, you need to first create a functional interface to the Metric table. This interface will serve as the source of data for the KPIs. To ensure that the KPIs have access to the correct data, you will need to reference the interface name when defining them. Keep in mind that the KPIs will require live data, so the interface must be properly configured to facilitate this.
To follow this tutorial properly, remember to:
Give your ODBC interface the name ODBC-Metrics.
Update the Connect String to point to the MiningData database.
To learn how to install a new ODBC Interface, refer to the Interfaces guide of this documentation.
If your verification fails and the Connect String isn't correct, that means there is some database security problem. Step 2 talks about this, but if you are still stuck then please contact our Support and we will help you out.
Verify and test the ODBC connection
Once you have installed and configured the ODBC interface, you should verify if the interface can connect to the database. Use Visual KPI Server Manager to confirm the connection.
To learn how to verify that everything is set up correctly, refer to the Interfaces guide of this documentation.
Write queries to access data
With an installed interface that points and connects to the MiningData database, you need to write three queries that will access the data needed for the KPIs.
For this tutorial, we will provide you with the three queries. Copy and paste the following queries into the appropriate fields for the ODBC-Metrics interface:
- Get Current Value query: When given an input or set of input parameters, returns the most current value and timestamp.
select top 1 {0} as Value, Timestamp as Date from Metrics
where Timestamp <= GetDate() and {0} is not null
order by Timestamp desc;
- Get Historical Value Query: When given an input or set of input parameters and a timestamp, returns a single value and timestamp (historical value closest and not after the timestamp).
select top 1 {0} as Value, Timestamp as Date from Metrics
where Timestamp <= {TIMESTAMP} and {0} is not null
order by Timestamp desc;
- Get Trend Data Query: When given a specific range of input parameters, including a start and end timestamp, returns a set of values and timestamps that fall within this range. To ensure that there is no empty space at the beginning or end of the trend, we recommend also returning the previous and following value/timestamp pair.
select {0} as Value, Timestamp as Date from Metrics
where Timestamp BETWEEN {STARTDATE} AND {ENDDATE} and {0} is not null
union
select Value, Timestamp
as Date from
(select top 1 {0} as value, timestamp from Metrics
where Timestamp < {STARTDATE} and {0} is not null order by Timestamp desc)
as First union
select Value, Timestamp as Date from
(select top 1 {0} as value, timestamp from Metrics
where Timestamp > {ENDDATE} and {0} is not null order by Timestamp asc)
as Last
order by Timestamp asc;
Verify the Interface
You can validate if you are receiving data through the interface. To check the current value, follow these steps:
- Select the ODBC-Metrics interface in the left panel.
- Select Get Current Value Query in the right panel.
- Click the more icon (…) after the Get Current Value Query string at the far right side. The following window will open:
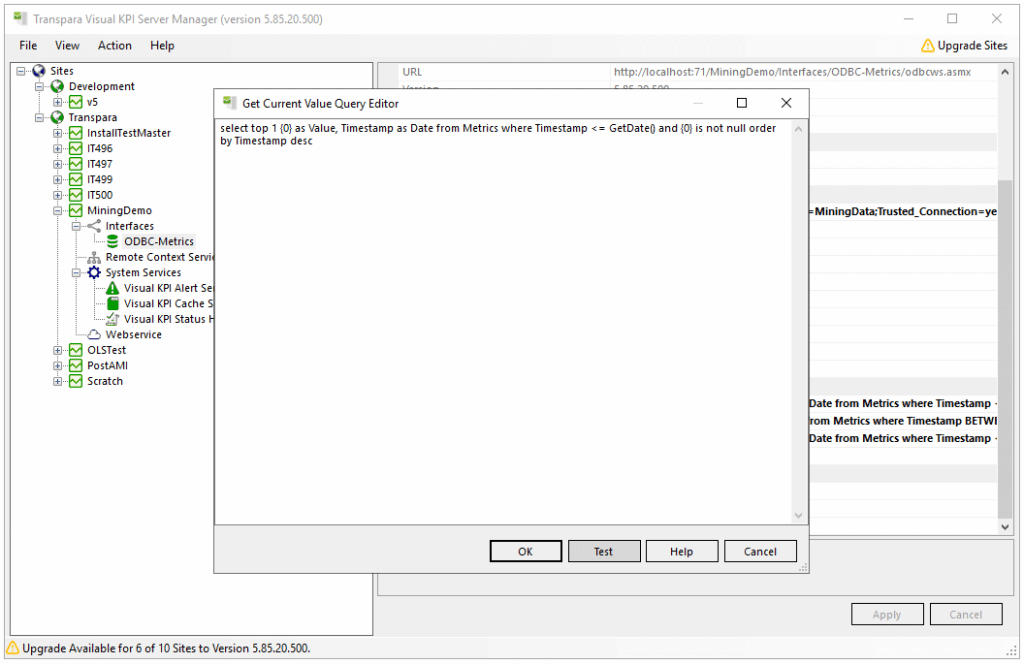
- Click on the Test button.
- Enter a column name, such as
T01_HourlyTons, which will show the most recent hourly tonnage forTruck01. - Execute the query.
This will return a value and a timestamp. Showing you have a working and tested ODBC interface to the Metrics table.
Step 5: Install the RCS
Now you will install a SQL Remote Context Server and understand the queries needed. Don't worry, we've provided these queries for you.
Start the RCS Install
Install a new Remote Context Server (RCS). To learn how, refer to the Installation guide.
When installing, select SQL RC Service option.
Connect to the database
You need to configure the Source ConnectString to connect to the MiningData database. Remember the interface interacts with the Metrics table and the RCS will interact with the Mines and Trucks tables. Follow these steps:
- In Visual KPI Server Manager, select Remote Context Services > Visual KPI SQL RCS Server (MiningDemo).
- In the right panel, select Source Database Configuration > Source ConnectString.
- Select the MiningData database.
- Apply the changes.
Configure RCS properties
Consider the settings for each section of properties for the SQL remote context service just installed.
-
Logging Settings: By default, only errors that occur during RCS execution will be logged to the Windows Event Log. However, if you're working on RCS query development and need to understand why certain objects aren't showing up, you can set the logging level to Full and keep an eye on the event log. This will help you to track down the issue and gain a better understanding of what's happening.
-
SQL Remote Context Service Settings: The RCS is scheduled to run at regular intervals, with a default interval of one minute. This means that after each run, the RCS will wait for one minute before running again. It is important to note that remote context services only analyze metadata and not process data. Since metadata is slow-moving data (like 'what trucks do I own' and 'what mines do I own'), it shouldn't change rapidly. Therefore, there is no need to run the RCS too frequently. During development, we recommend keeping the interval at one minute, but once it is operational, you can adjust it to be hourly or even daily.
- In this section, there are two options - Enabled and Allow Updates. The Enabled option determines whether the RCS will run or not. The Allow Updates option controls whether the RCS will update the objects it has already created. For instance, if a mine named Mine 01 with an ID of M01 changes, the RCS will only update its objects if Allow Updates is set to True. If it is set to False, the RCS will only create new objects and not update the existing ones. We can leave this option as True to allow the RCS to update objects whenever necessary.
-
Definition Queries: This is where we provide queries to extract definitions for creating Groups, KPIs, charts, and tables from metadata (more on this later).
-
Relationships Queries: In this section, you can provide queries to establish the relationships between Groups and other objects. The definition queries are used to create objects, while the relationship queries are used to build the hierarchy (more on this later). These two types of queries work together because you can't position an object in a hierarchy (relationship query) if the object hasn't been defined (definition query).
-
Profile & Dashboard Queries: These queries are used to create dashboards, including profile groups, profiles, widgets, and bookmarks.
-
Pre & Post Process Queries: These queries can be helpful for manipulating metadata. They can be run before or after other queries to process data or perform ETL tasks. They're useful for handling any data manipulation required on the metadata.
-
Error Handling: This section explains how the RCS handles queries that don't return any data. Whenever the RCS is executed, a MetaID is used to map the objects in the foreign system (for example, the data stored in the MiningData database) to the objects in Visual KPI (such as Groups, KPIs, Charts, etc.). The RCS will either:
- Create Visual KPI objects (we detect an unknown MetaID).
- Update Visual KPI objects (we detect a known MetaID).
- Delete Visual KPI objects (we have a MetaID stored that's no longer being passed to use via a definition query).
If you have set one of these to True and the query provided returns nothing, it will throw an error in the Event Log and stop processing. For instance, if you created 20 KPIs in the first run, and the next time the query ran, you got no KPIs, it will either delete the existing 20 KPIs, which is often not preferred, or it will throw an error and stop the process until the next round.
Step 6: Start the RCS
You can now look at the fruits of your labor. Your progress so far includes installing and configuring various components such as data, a Visual KPI Instance, an ODBC interface, and a SQL RCS that generates Groups and KPIs. Let's test it out to see if everything is working properly.
Right-click on the SQL RCS in the Server Manager and select Start.
After being initiated, the RCS will execute the queries and create, update, or delete data as instructed by the queries. Once the execution is complete, and a cache cycle has been run to gather the actual process data, you can view the results on the Groups tab of the Visual KPI site.
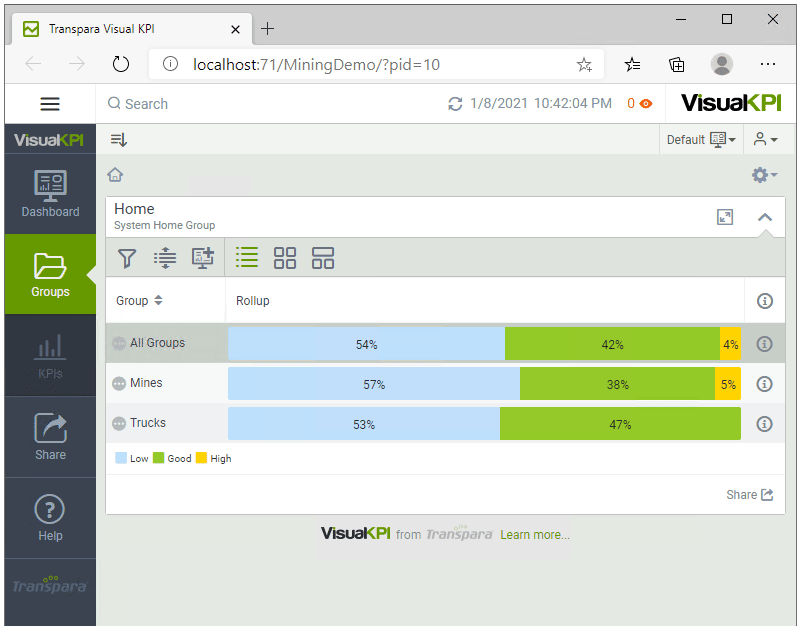
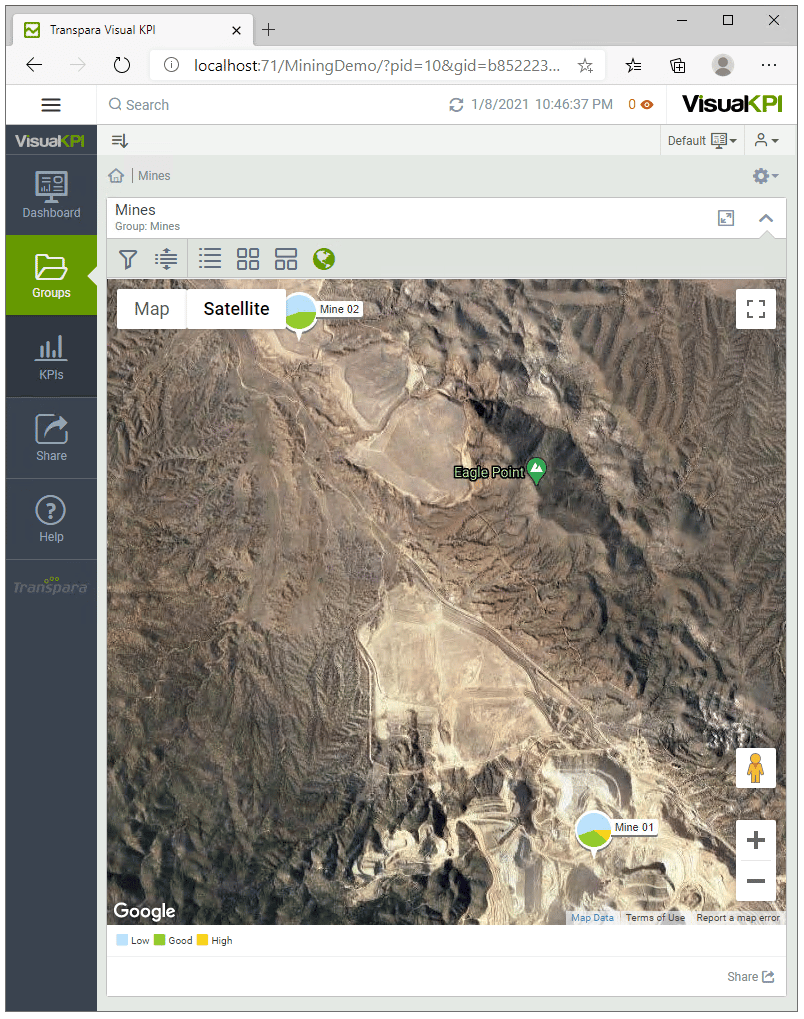
Since location data was also added, you will also be able to view Geo Maps.
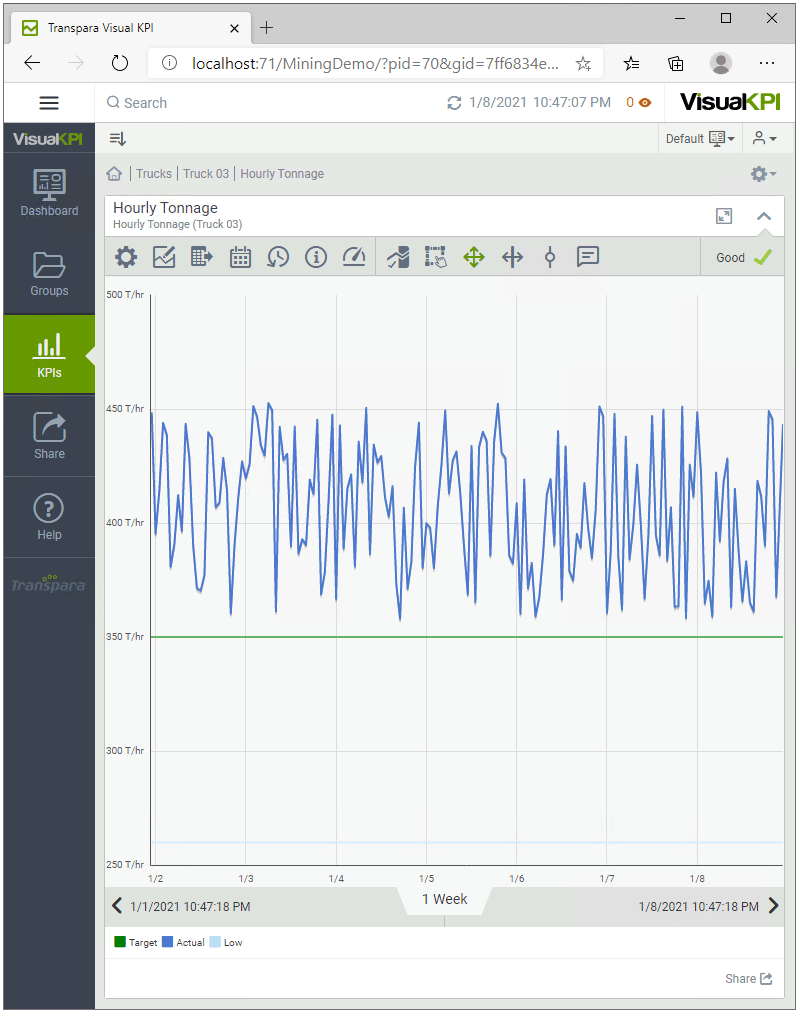
Because you created and referenced the ODBC interface, you can also see historical data on trends. All of that from a few lines of SQL.
You can also see that everything that was created in Visual KPI Designer has been updated. Go ahead and pull up the Groups and KPIs. It should be similar to this:
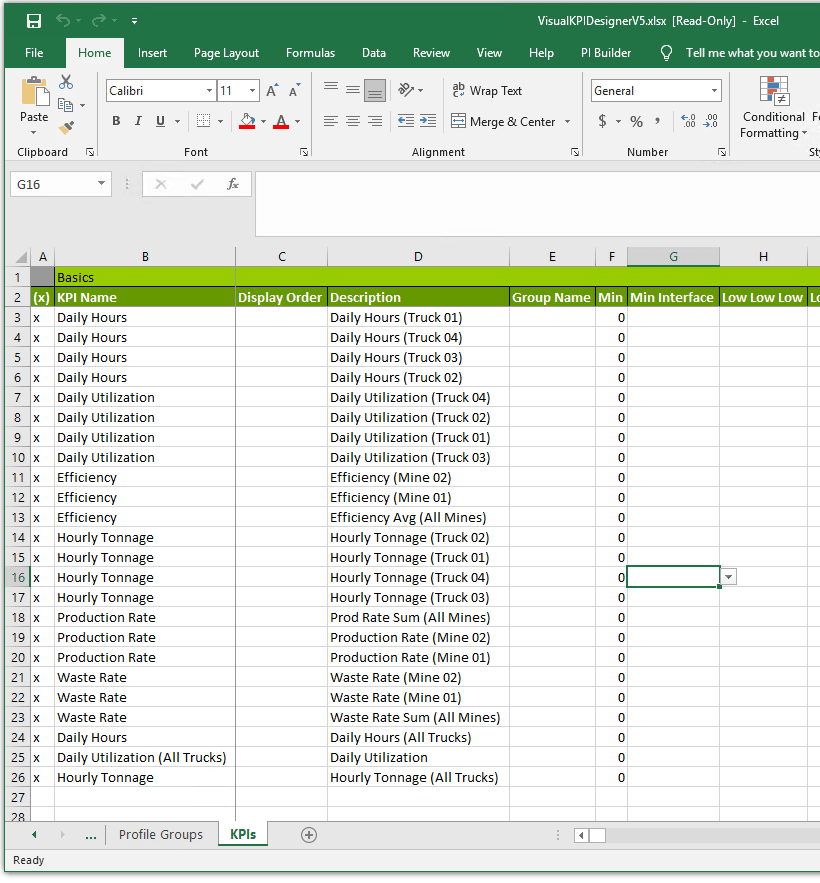
By default, the RCS updates constantly. As a result, any modifications you make in Visual KPI Designer will be lost when the SQL RCS runs next time. Keep in mind that the MiningData database is now the master, and we're simply following its lead.
Step 7: Add More Data
Run demoscript2.sql against our MiningData database in SQL Server Management Studio (SSMS).
This script will add more Mines and Trucks along with hourly/daily metric data for all the new equipment, and should take about 20 seconds to run.
If you haven't stopped the RCS and it has been running continuously, then please take a moment to check your website. As you may have guessed, new groups have been created for the mines and trucks, along with new KPIs, using the same definition and relationship queries that we used before.
The best part is, no code changes are required, and you still have the same level of insight into the operations with 10 mines and 20 trucks as you did with just two mines and four trucks.
Step 8: Add Visualizations
Now that you have expanded your mining empire and set up groups and KPIs to monitor it, it is time to enhance your visualizations. Visual KPI offers a range of chart options, including bar charts, managed trends, Pareto charts, Gantt charts, pie charts, XY plots, tables, and more. You can create these visualizations using the SQL remote context server.
You need two queries for each object type, a definition query (think of filling in the Visual KPI Designer spreadsheet), and a relationship query to specify the groups where the new charts will be located.
When you ran the demoscript2.sql script, you were provided the following stored procedures:
-
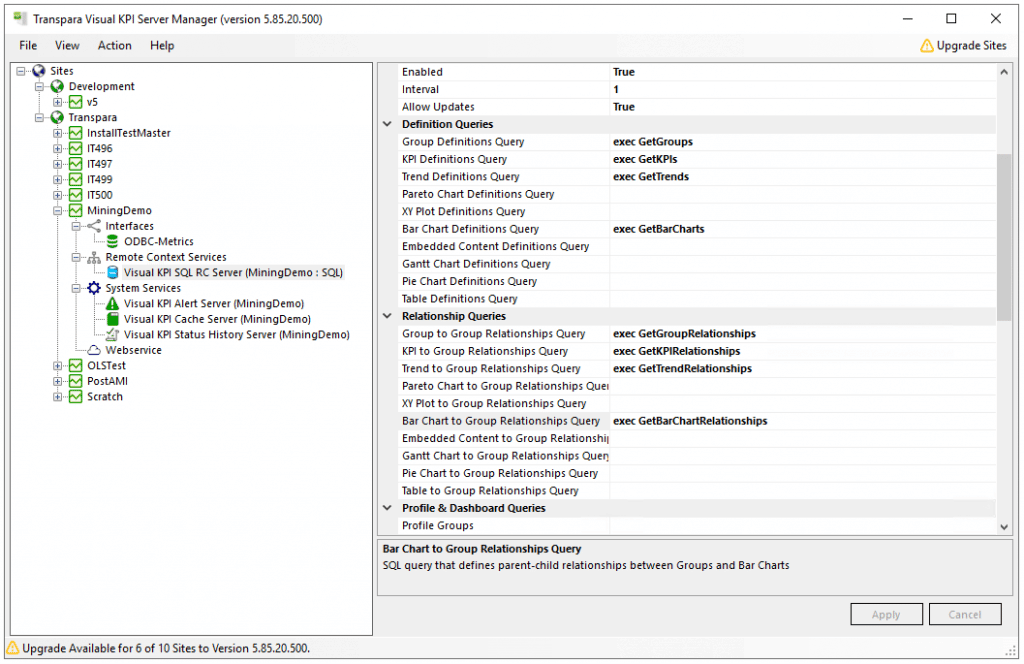
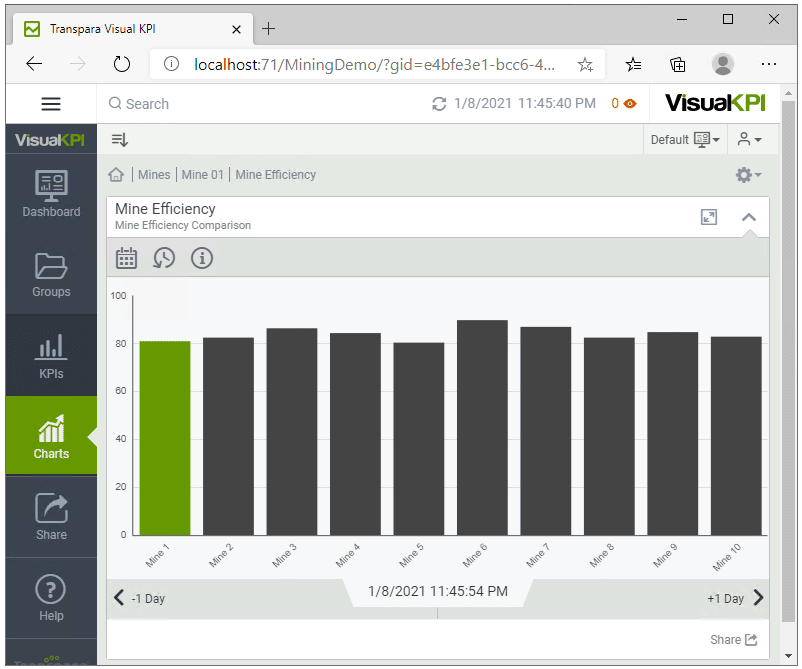
GetBarCharts: This stored procedure generates a bar chart for each mine. The chart will consist of 10 bars (one per mine), with the bar colored indicating which mine is being viewed. The query returns the MetaID, Name, and some bar definitions, which are all important to note. -
GetBarChartRelationships: Retrieves each bar chart's MetaID from theGetBarChartquery and associates it with the mine MetaIDs from theGetGroupsquery. This process is similar to that ofGetKPIRelationships. As a result, the Group with the MetaID of M01 will now include a bar chart with the MetaID: M01_BarChart. -
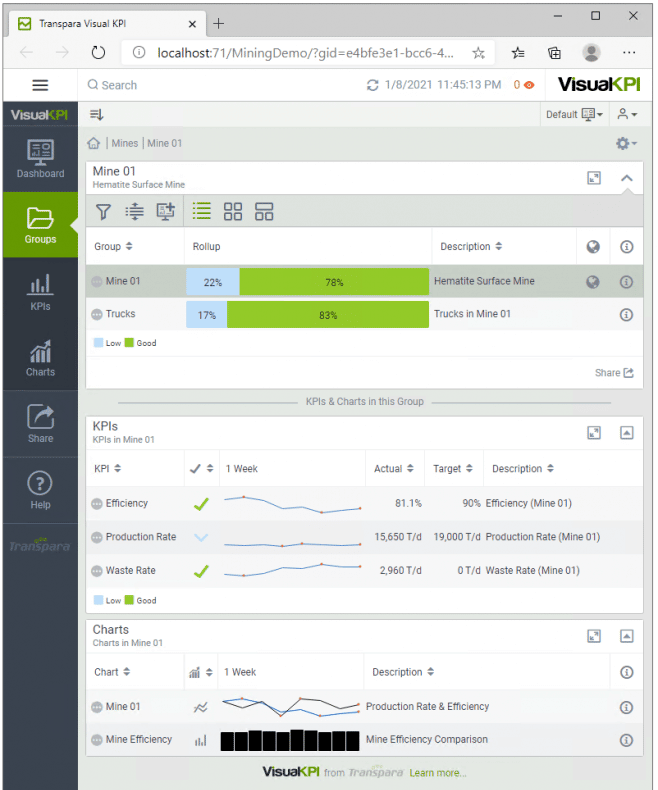
GetTrends: Returns 10 trends (1 per mine) comparing Production Rate and Efficiency metrics. -
GetTrendRelationships: Retrieves each bar chart's MetaID from theGetTrendsquery and associates it with the mine MetaIDs from theGetGroupsquery.
Now, in the Visual KPI Server Manager, add these four queries/stored procedures to the RCS configuration and apply it, like presented in the image below:
After the RCS and Cache Server finish running, you can see the following in your Visual KPI site:
- Trends
- Bar Charts
Step 9: Using queries to create dashboards
Dashboards are collections of widgets that belong to profiles and profile groups. In order to create functional dashboards on Visual KPI sites, the following need to be created:
- At least one profile group (unless we use the default one).
- At least one profile.
- One or more dashboards (which are just widget containers).
- Several widgets.
The scripts ran earlier in this tutorial provided you with the following stored procedures:
-
GetProfileGroups: Returns a single profile group called Mines. -
GetProfiles: This query is similar to theGetProfileGroupsquery. However, it refers to the MetaID of the recently created profile group. The purpose of this query is to create a profile named "Mines" and add it as a member of the profile group with the MetaID, which is also known as the ProfileGroupMetaID, of the Mines profile group. -
GetDashboards: Returns 10 dashboards (1 per mine) belonging to the profile called Mines with the MetaID (ProfileMetaID) ProfileMines. -
GetWidgets: When creating a widget, it is important to specify its position and size. Additionally, the widget should be linked to a specific item. For instance, if we want to create a KPI block, we need to provide the ObjectMetaID of the KPI that we want to display. Some widget types offer a variety of options. For example, KPI Blocks can be configured to hide their sparklines. Conversely, some widget types don't offer any options at all. The GetWidgets query will return seven widgets per dashboard (70 rows). Each widget has the following elements:- MetaID
- DashboardMetaID (MetaID of the dashboard it will belong to)
- Positioning data (RowStart, ColumnStart)
- Sizing data (Height and Weight)
- WidgetType (a KPI Block, a trend, KPI map, Geo Map, etc)
- ObjectMetaID (type of object)
- Options (such as Expand)
As relationships are defined in each query, there is no need for relationship queries with the current structure of widgets, dashboards, profiles, and profile groups.
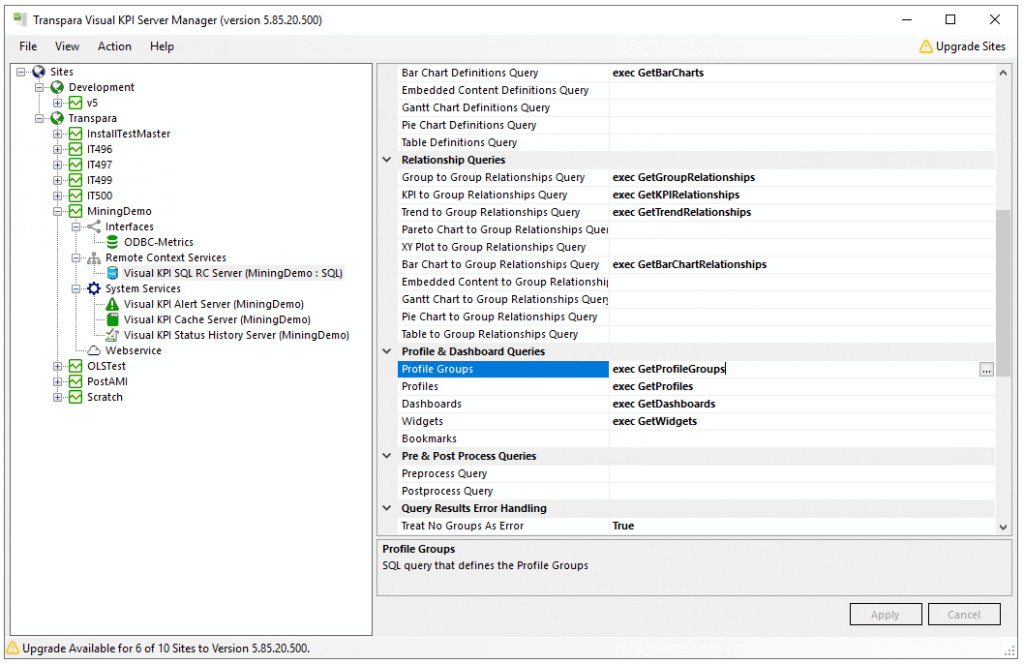
In Visual KPI Server Manager, follow the steps below to create profile groups, profiles, dashboards and widgets:
- Select the MiningDemo RCS.
- Enter each of the four queries in the appropriate fields in the RCS.
- Click Apply.
The image below can be used as an example of this process:
You can also set default profiles, lock them, and assign default ranges to dashboards, all via the RCS. Simply include the necessary columns as shown in Visual KPI Designer. You can view Profile Groups, Profiles, and Dashboards in Visual KPI Designer for reference. If you want to lock your dashboards, you can do so by adding a column (attribute) called "Locked" to your dashboard query and assigning it a value of 1 or True.
View Profiles and Dashboards
Once you have entered each query and clicked on the Apply button, you can open your Visual KPI site in a web browser to view the new dashboards. Usually, the site will display the default profile (named Default), and you will have to change it to view the new dashboards. To change it, do the following:
- Click the Profile icon on your Visual KPI site.
- Select Default (Change Profile).
- Use the pull-down menu to select the Mines profile group and Mines profile.
- Click Select.
You can access other dashboards for each mine by using the dashboard pull-down menu.
