Transpara tStore Interface
To work with Transpara tStore interface, you need to install it in your Server Manager, connecting it to your tStore API. By default, all tStore APIs are configured on port 10001.
Installing tStore Interfaces
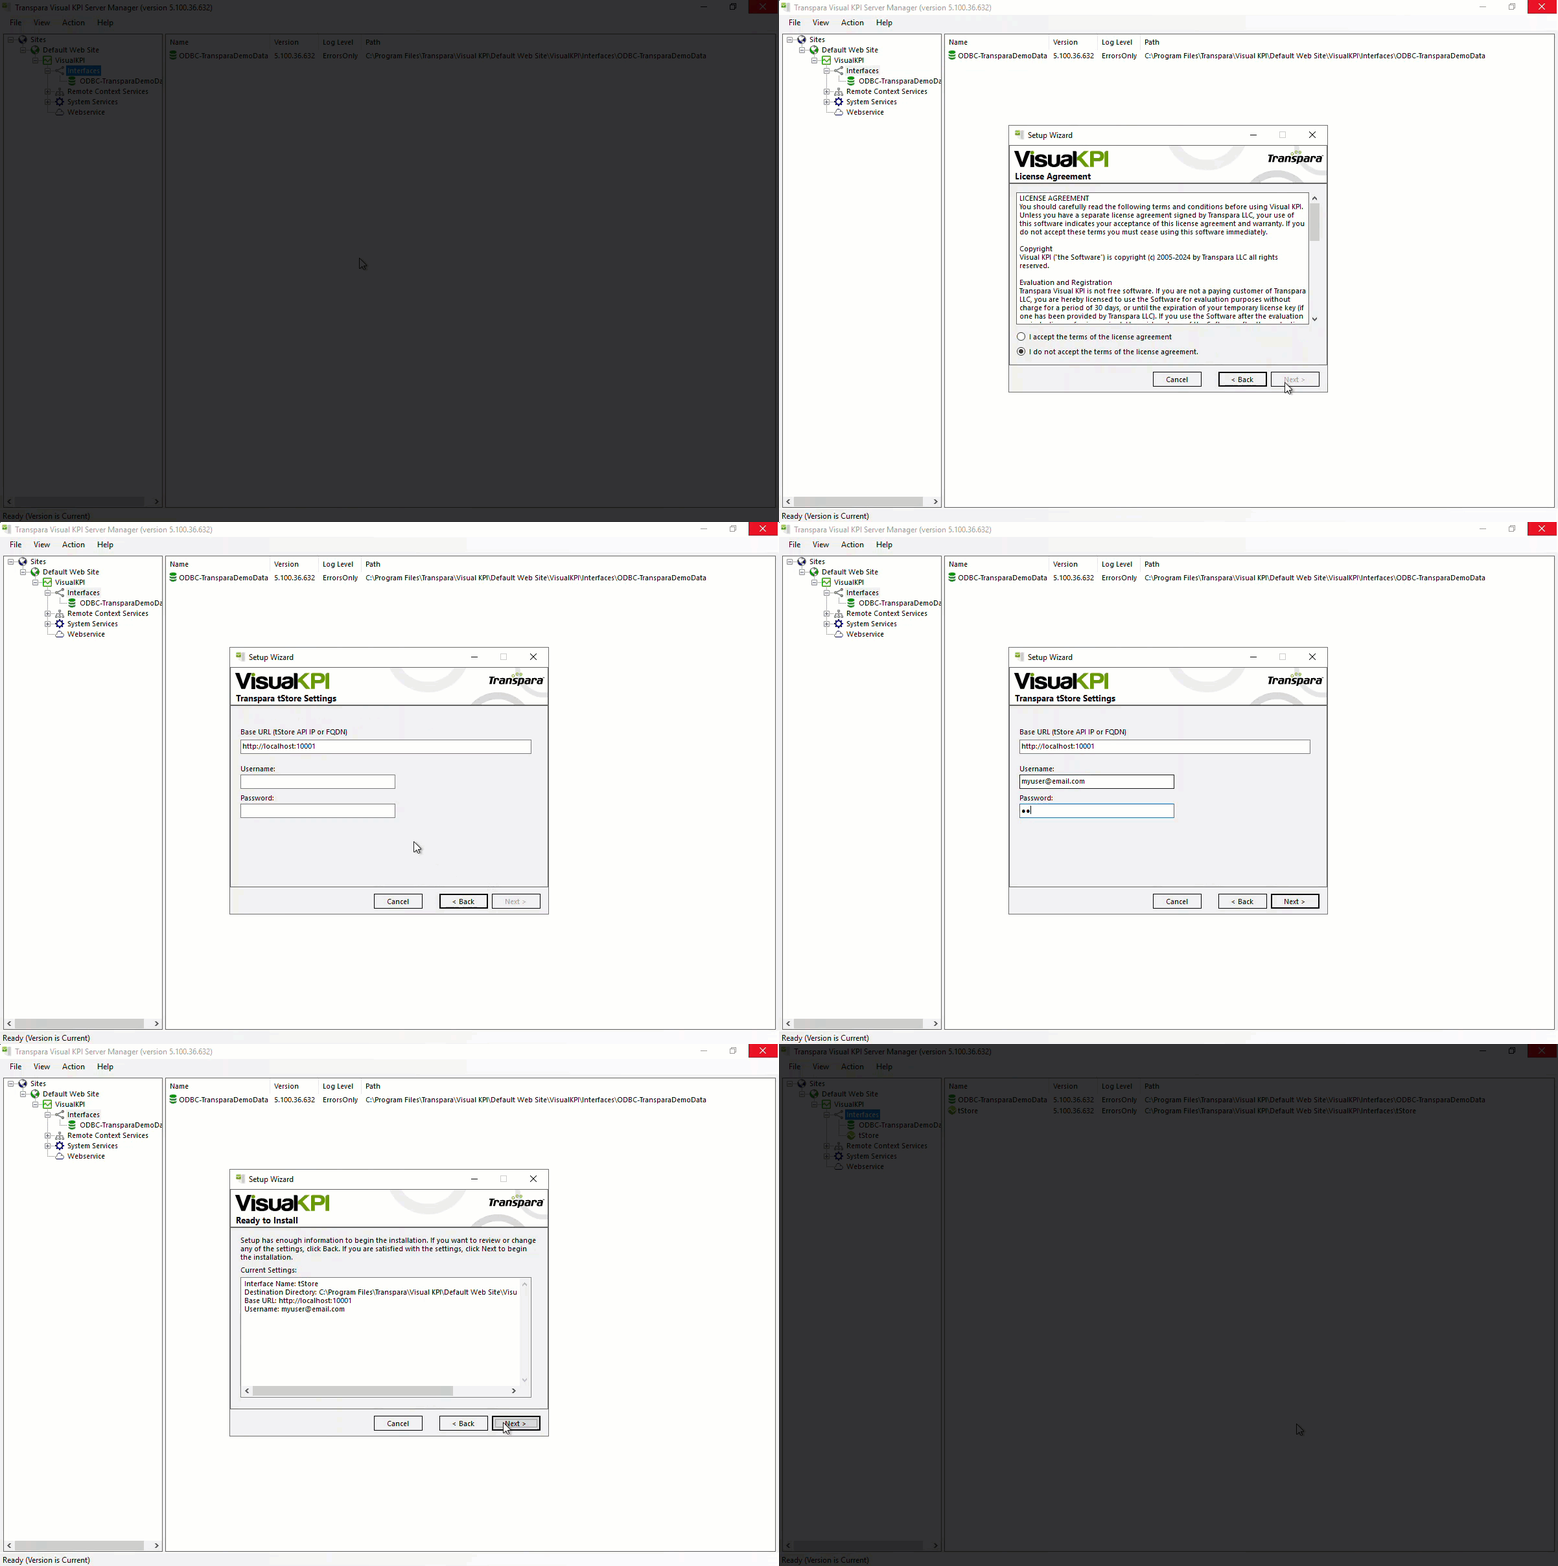
To correctly install tStore interface, follow the steps below:
- Open your Visual KPI Server Manager.
- Right-click on Interfaces.
- Select Transpara tStore Interface under the Install New Visual KPI Interface option.
- Follow the install wizard.
- Add the Base URL for your tStore API, along with credentials to access it.
- Complete the installation.
Below you find an example of this process:

Working with tStore Interface
The tStore interface can receive up to four parameter, with only the first one being required. The four parameters are described below:
- Metric: The value which needs to be recovered.
- Filter (Optional): Conditions applied to the data source to selectively include or exclude specific elements. You can add multiple filters, separating them with commas.
- AggregationFunction (Optional): Operation applied to a set of values or data points to produce a single, summarized result. The available options for this are:
raw, avg, sum, count, min, max, range, stddev, median, twavg
- AggregationBucket (Optional): Grouping of data points based on certain criteria.
Retrieving Available Lookups
You can use your tStore API to recover the metrics you have. Use the following endpoints to find the lookups available in your tStore:
Retrieve Metrics
The GET/metric endpoints returns a list of available metrics:
- Request
- Response
curl -X 'GET' \
    'http://<YOUR_BASE_URL>:10001/api/v1/metric/' \
    -H 'accept: application/json' \
    -H 'Authorization: Bearer eyJhbGci...xCKoX0Pv4'
[
    "simdata"
]
Retrieve Lookups
The GET/metric/lookup requires a metric quey parameter, recovered in the previous request, and returns a list of lookups available for it.
- Request
- Response
curl -X 'GET' \
    'http://<YOUR_BASE_URL>:10001/api/v1/metric/lookup?metric=simdata' \
    -H 'accept: application/json' \
    -H 'Authorization: Bearer eyJhbGci...xCKoX0Pv4'
[
    {
        "metric_name": "simdata",
        "lookup_id": 1,
        "lookup": "simdata|tag=downtime",
        "labels": {
        "tag": "downtime"
        },
        "enum_id": null
    },
    {
        "metric_name": "simdata",
        "lookup_id": 2,
        "lookup": "simdata|tag=oee",
        "labels": {
        "tag": "oee"
        },
        "enum_id": null
    },
    ...
    ]
How to Use Lookups
To use these parameters as lookups in Visual KPI Designer, or for testing the interface, you will need to separe them with pipes, as presented below:
Metric|Filter|AggregationFunction|AggregationBucket
Below you find examples of use:
| Scenario | Example |
|---|---|
Adds wavelength as metric. | wavelength |
| Adds a filter or multiple filters to the lookup. Where filters are equal to asset=sn1051_kalkallo,fiber=1,sensor=1. | wavelength|asset=sn1051_kalkallo,fiber=1,sensor=1 |
| Adds AggregationFunction and AggregationBucket to the lookup. Where: - AggregationFunction = avg - AggregationBucket = 5 mins | wavelength|asset=sn1051_kalkallo,fiber=1,sensor=1|avg|5 mins |
| Adds AggregationFunction and AggregationBucket and skips filter, leaving the space between the two pipes empty. | wavelength||avg|5 mins |