Dashboards
From the Visual KPI Dashboard, you can monitor all of your information, personalize the Dashboard, and add new visualizations. You can have as many Dashboards as you want. They're part of profiles. The Dashboard is your personalized or role-based visualization of KPIs and other object types (charts, groups, tables, embedded content, etc.).
The previous Dashboard page addressed the main dashboard functionalities, such as the options menu, creating a dashboard, setting properties, resizing and moving a KPI, selecting a KPI visualization, adding a new object, and adding a custom time range. This section will investigate the dashboard features and explore other ways to take advantage of this crucial tool.
Dashboard properties
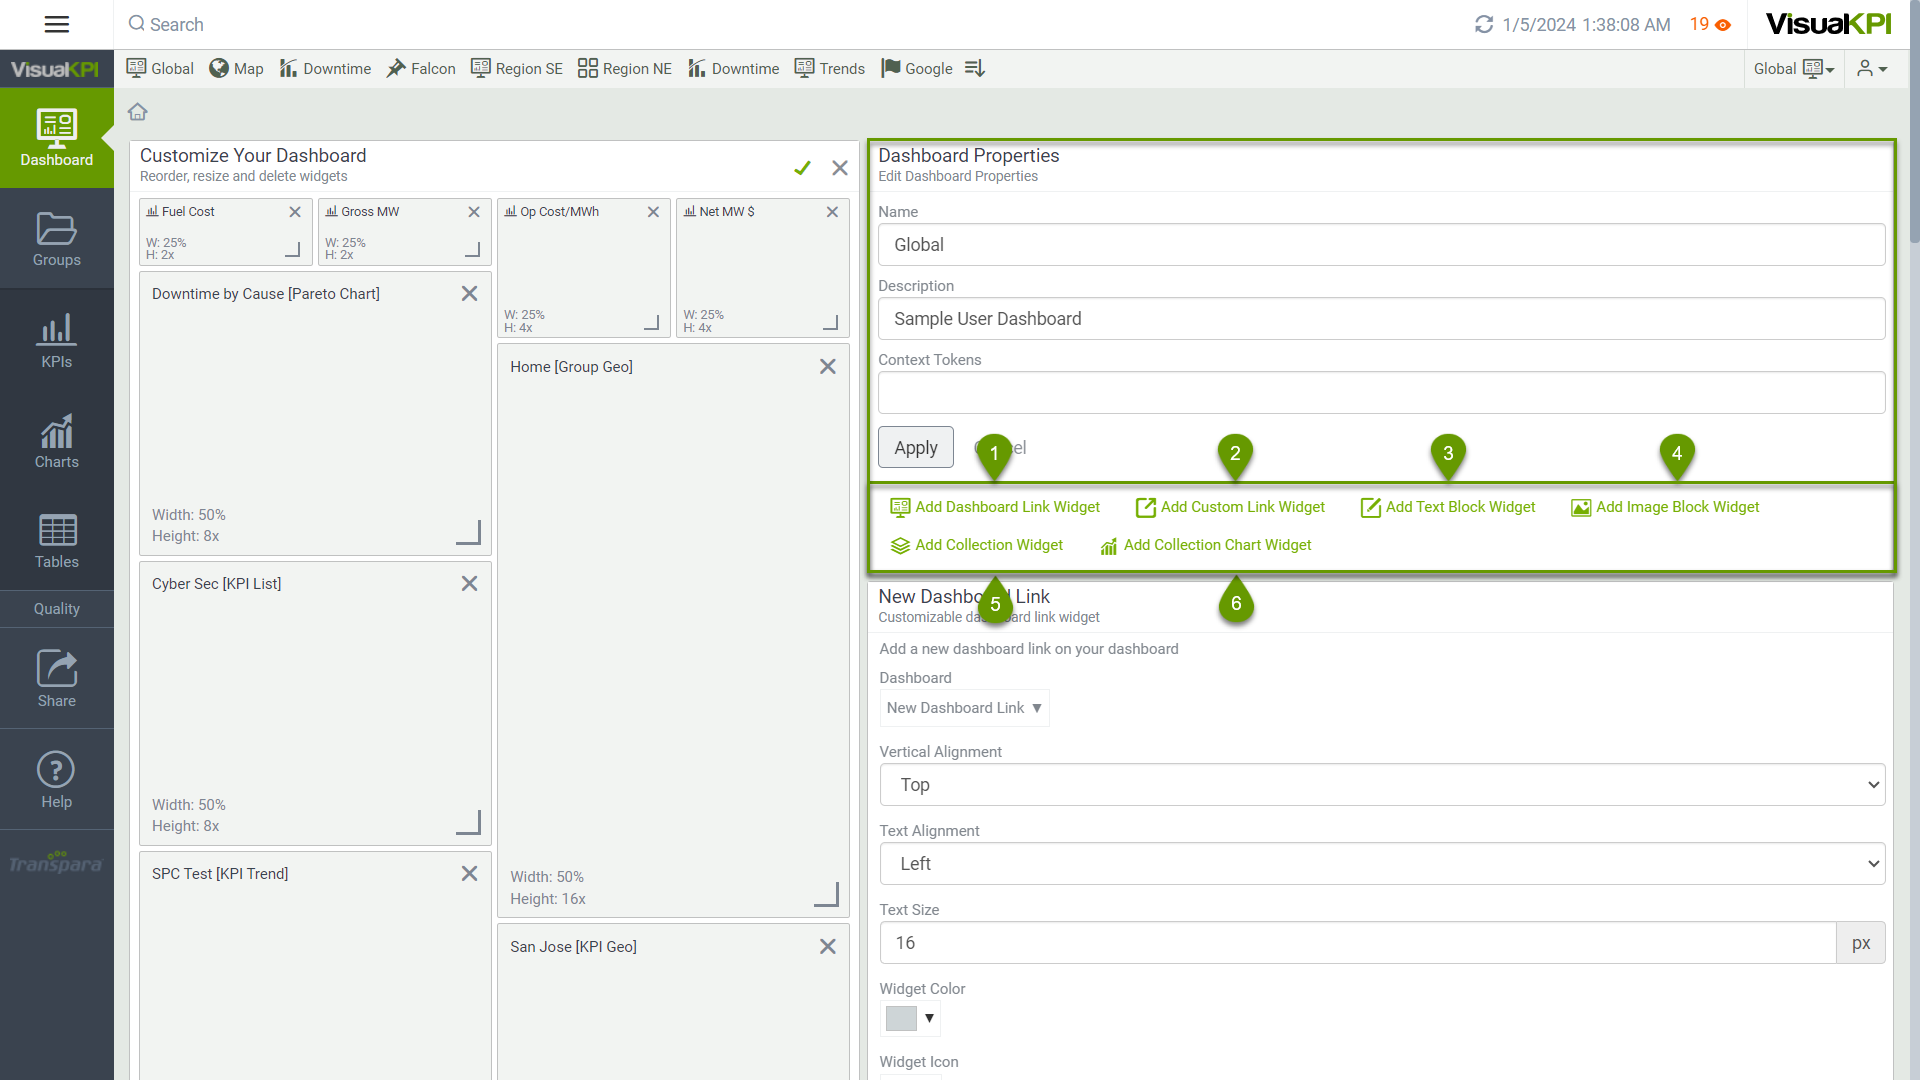
Once you click the Gear icon () and select Customize Dashboard, you find the following options for Dashboard Properties:
- Add Dashboard Link Widget
- Add Custom Link Widget
- Add Text Block Widget
- Add Image Block Widget
- Add Collection Widget
- Add Collection Chart Widget
Add a link widget
You can add and customize just about anything to your Dashboard, even elements that don't live in Visual KPI. Websites you often reference, links to Web-based software you need for your job, or Visual KPI Dashboards you monitor frequently. These Dashboard elements are called link widgets. If it has a URL, you can link it.
Some elements you can add as a link widget:
- Another Dashboard within your profile.
- Another Dashboard from another profile to which you have access.
- A link to web-based software you may use for administrative purposes.
- A link to another website you monitor frequently.
- A link to a YouTube video.
Add a dashboard link widget
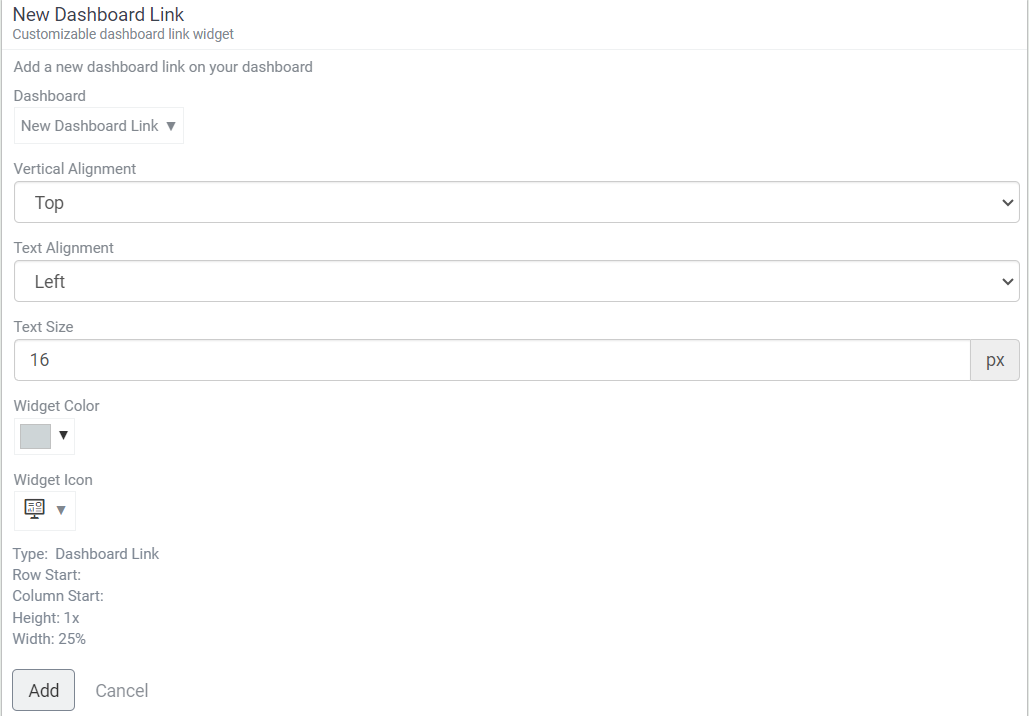
Once you click Add Dashboard Link Widget, select the Dashboard link you want to add to your Dashboard through the pull-down menu. You can choose it from any profile that you have access to. Then, configure your preferences for alignment, text size, color, and icon. Finally, click Add to immediately add it to your Dashboard. You can move and resize this widget in this same menu. Remember to Save your changes.
Add a custom link widget
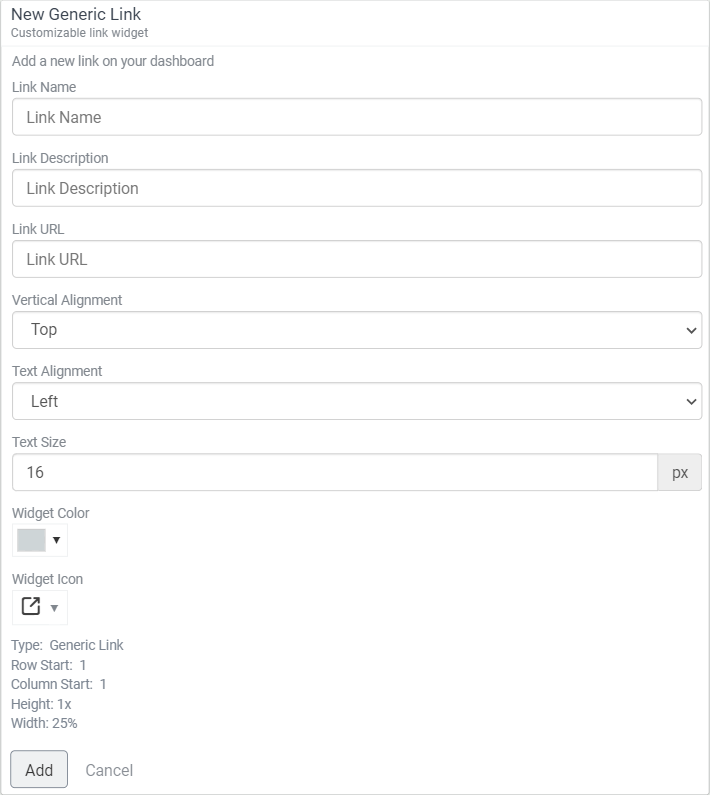
The Custom Link Widget, or Generic Link, adds a widget on the dashboard to just about anything you can link to with a URL. You can use links to objects inside Visual KPI, such as trends or KPIs, but it is easier to add these to the dashboard with the Add to Dashboard command within Options.
In the Dashboard Properties panel, click Add Custom Link Widget. Customize your new link widget by adding a name and an external link for the widget, choosing a widget color and icon, and clicking Add. After adjusting its position and size, click Save.
Add text block widget
You can add static or dynamic texts and images to your Visual KPI Dashboard. These widgets can be anywhere on your Visual KPI Dashboard.
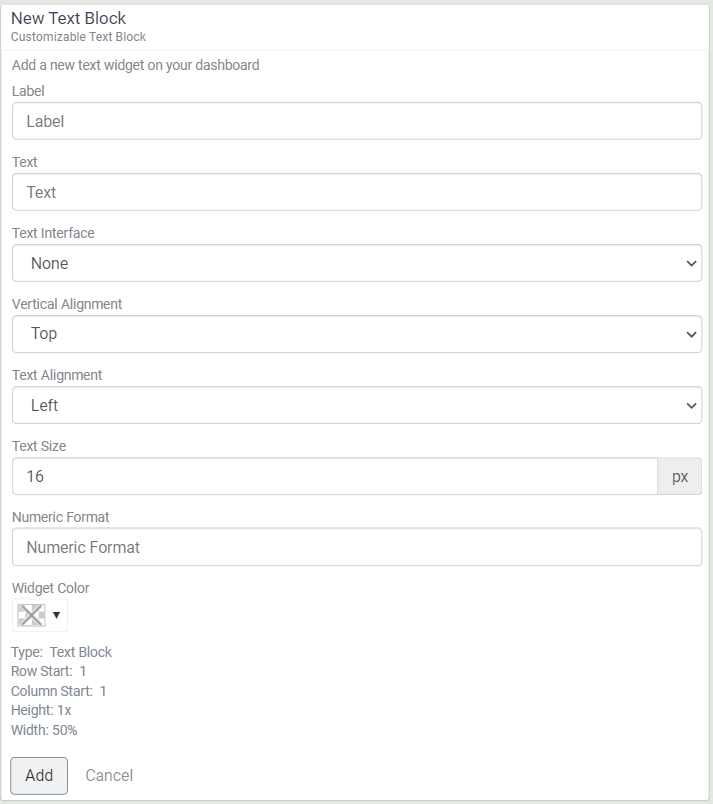
A static text block displays only the text you enter. Firstly, click Add Text Block Widget. Then, add a label for the text block, type your text, select text Alignment and size, select a background color for the widget, and click Add.
With a dynamic text block, Visual KPI will display information based on a data source. To set up a dynamic text block, enter a Lookup in the text field. This can be from any interface (tags, parameters, etc.) and can also include functions. Use the pull-down menu to select a data source in the Text Interface field, inform the alignment and coloring, and click Add.
Remember to Save it after adjusting its position and size.
Add image block widget
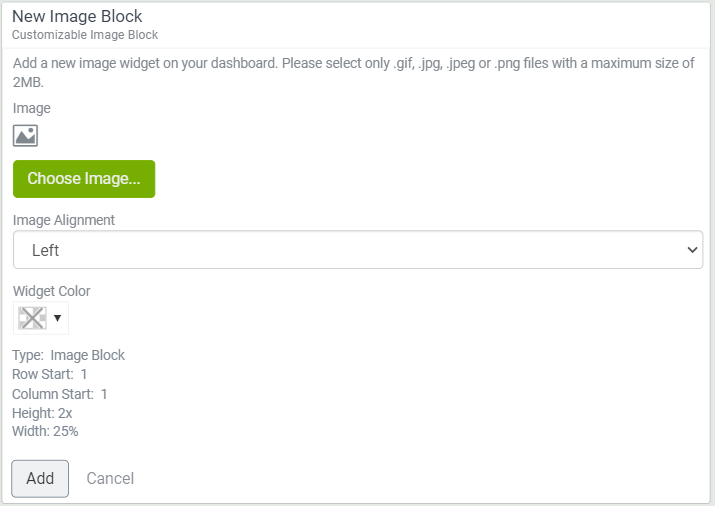
The Image Block Widget adds an uploaded image to the Dashboard. In the Dashboard Properties panel, click Add Image Block Widget. Then, upload an image, set the image alignment, select a background color for the widget, and click Add. Save it after you're done editing the size and position.
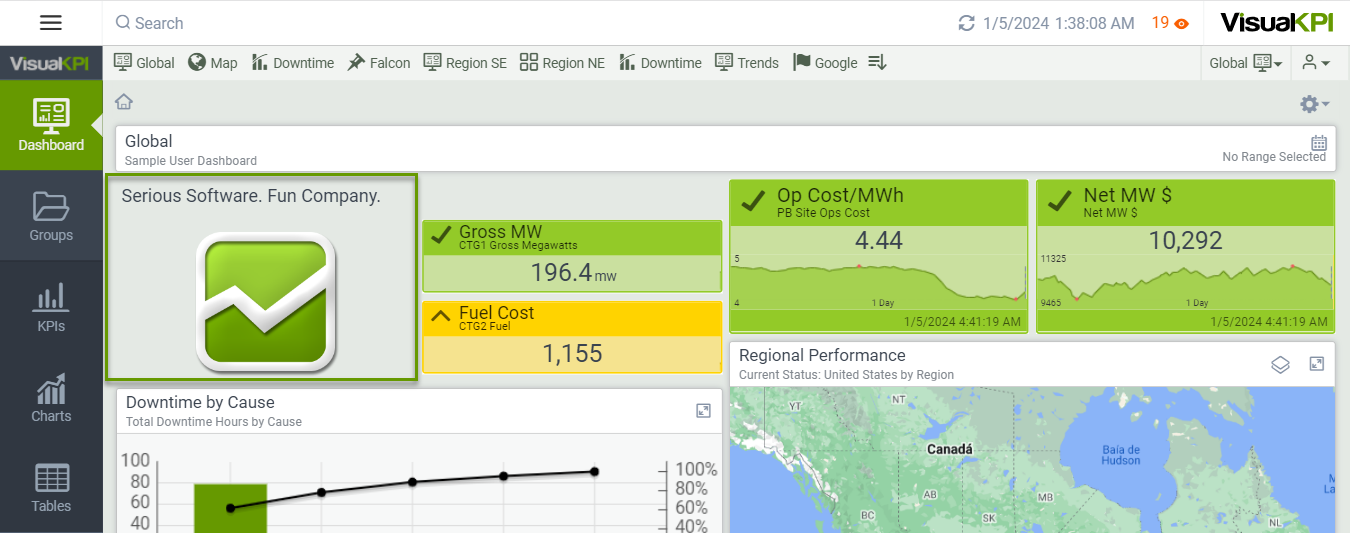
In the example below, the Transpara logo and the slogan are both custom widgets:
Add collection widget
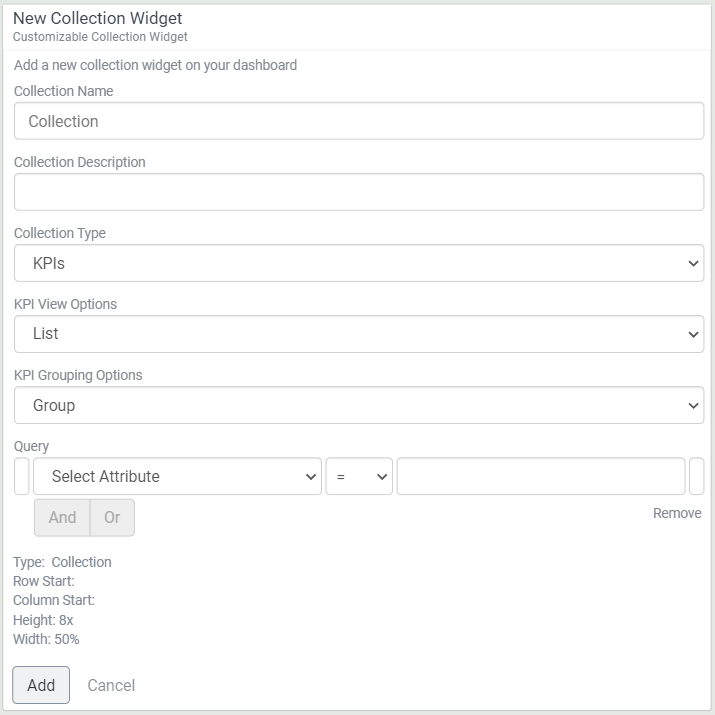
Use Add Collection Widget to add multiple objects to a Dashboard. Once you open the form, you can choose if you want a name and description and then use the pull-down menu to select the object type. You can choose between Groups, KPIs, Charts, and Tables. After that, select the KPI View and Grouping Options for your widget.
Add a collection chart widget
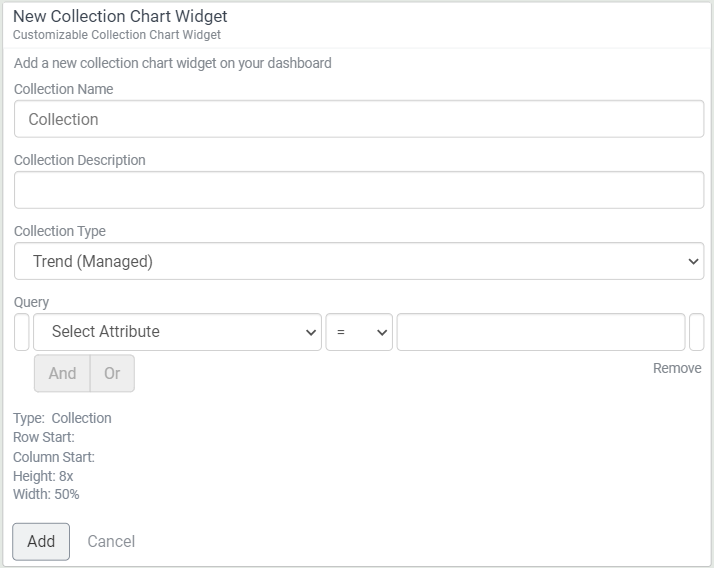
You can also use Add Collection Chart Widget to add multiple objects to a Dashboard. The main difference between this and Add Collection Widget is that this option presents the information in chart form. Name your widget and add a description. You can choose the information you want between Groups, KPIs, Charts, and Tables. Remember to Save after making all desired configurations.
Bulk add
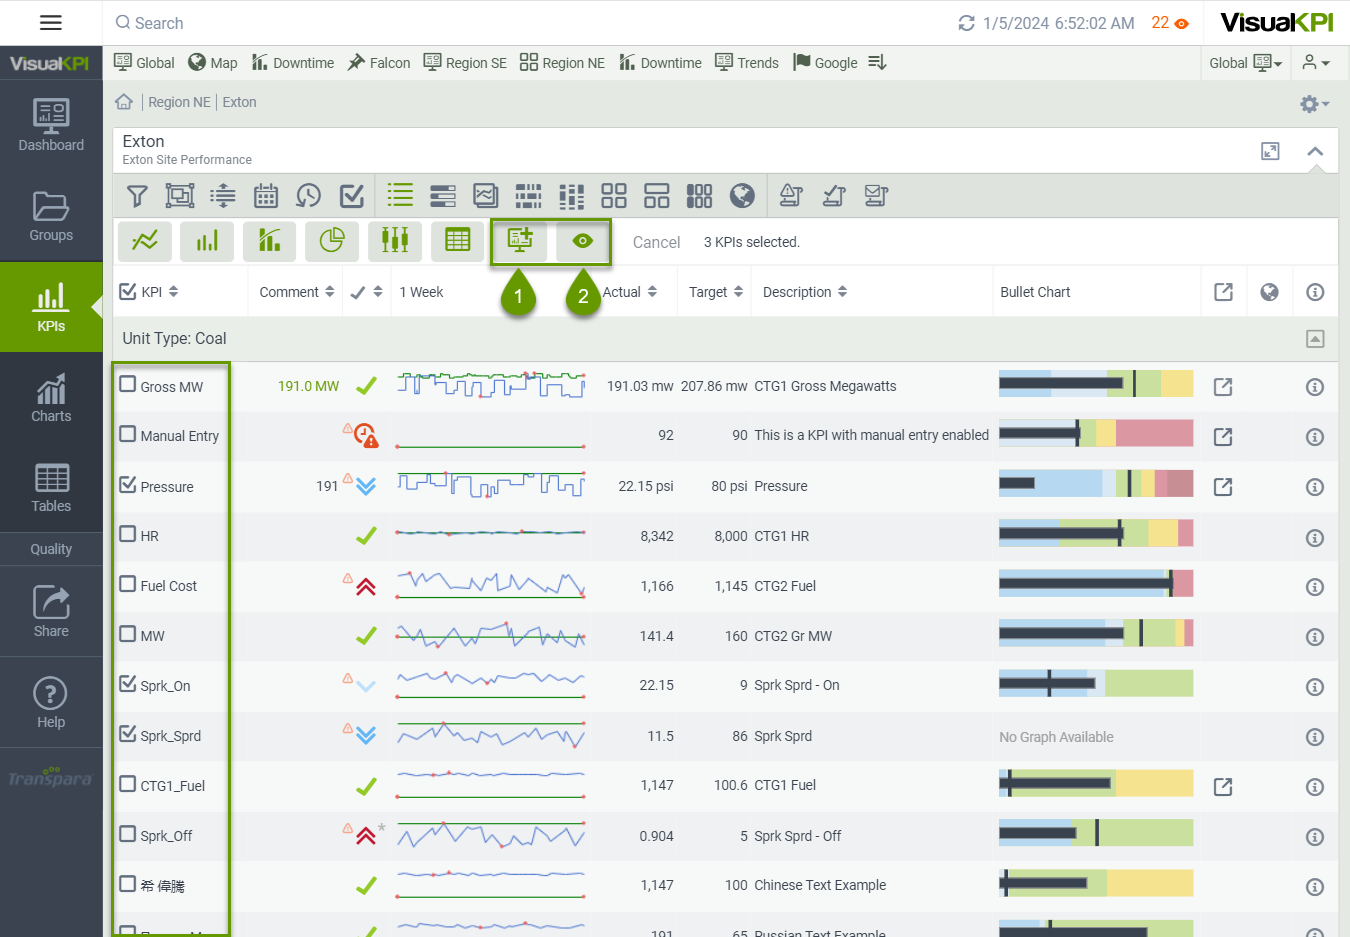
While you can add KPIs individually to your Dashboard or a Watchlist, you can also save time by adding multiple KPIs from a list. If the Dashboard you're viewing isn't locked, you can bulk-add up to 20 KPIs to a Dashboard or Watchlist from any KPI list view. Alternatively, if you want to add only in a Dashboard, you can use Add Collection Widget.
You can use Bulk Add by navigating the relevant group and list view. If the KPIs you want to add aren't in the same Group, you'll need to add them individually, but you can bulk-add up to 20 objects that are in the same group list view. Follow the steps:
- Navigate to the relevant group and list view.
- From the KPI list view, click the Select KPI icon ().
- Select multiple KPIs by clicking the box to the left of any KPI in the list.
- From the sub-menu, select the Dashboard () or Watchlist () icons to save the selected objects.
Observe the example below, which shows multiple KPIs selected in the Exton Group and both (1) Dashboard and (2) Watchlist icons.
Watchlist
Think of your Visual KPI Watchlist as those KPIs that could get you promoted or fired. Your Watchlist appears in the top bar of your Visual KPI site as an orange-colored number with an eye icon () next to it. This number shows how many KPIs are currently in alert status.
To add a KPI to your Visual KPI Watchlist, follow the steps:
- Go to the KPI you want to add to your Watchlist.
- Click List View.
- Select the KPIs to add to your Watchlist.
- Click Add To Watchlist.
- Your selected KPIs are added to your Visual KPI Watchlist.
What's next?
Take a look at our Hierarchy/Groups page to learn more about differentiating objects that compose Groups and how to use their various view options to get the best out of Visual KPI.