Features & Configuration
Visual KPI Designer enables you to set all configurations for your website from one place. For example, you can define the appearance, colors, and icons of objects, KPIs, and trends. You can also set the behavior of several features.
To access the features and configurations, follow the steps:
- Click the Site Settings icon (
 ).
). - Select Features & Config.
- Choose the desired option to open its worksheet.
Use the following buttons to check the available configurations for each one of the available options.
Website
The Website settings enable you to define basic configuration information for Visual KPI sites. The available configurations are grouped into categories, which you can explore below. Access the Visual KPI Website reference page to check the descriptions for all settings.
It is important to note that you shouldn't create any additional configuration within the Website worksheet. You should only edit the cells from the Value column.
Site Basics
This category includes configurations that define the fundamental properties of the Visual KPI website. These settings determine the site's title, default groupings, contact information, logo behavior, data update intervals, and default themes. It also includes options for user customization regarding themes and time displays, as well as settings related to memory management and link behaviors.
Access the reference page to see the descriptions of all available configurations.
System Services
System Services configurations manage the background operations and system notifications. These settings control how cache and alert notifications are handled, the storage duration of various metrics, and intervals for warning notifications. This category ensures the smooth operation and monitoring of the system's health and performance.
Access the reference page to see the descriptions of all available configurations.
Tab Defaults
These settings control the initial display views for groups, KPIs, charts, and tables, ensuring a consistent user experience across the site.
Access the reference page to see the descriptions of all available configurations.
Column Defaults
This category deals with the default naming conventions for columns displayed within groups, KPIs, charts, and tables. It ensures that the naming is consistent and straightforward for users interacting with different data types.
Access the reference page to see the descriptions of all available configurations.
Text, Number, and Size Defaults
These configurations manage the default formats and limits for textual and numerical data displayed on the website. They control how numbers are formatted, the maximum number of items displayed in various contexts, and the length of lookup texts, among other things.
Access the reference page to see the descriptions of all available configurations.
Geo Map and Near Me Settings
These settings affect the functionality and display of Geo Maps and location-based features. Configurations include default distance units, label formats, marker behaviors, and the display of location history on maps.
Access the reference page to see the descriptions of all available configurations.
Chart & Table Settings
Chart and Table Settings control the behavior and appearance of charts and tables on the website. This includes enabling dynamic updates, setting cursor limits, displaying calculations and grid lines, and controlling the scroll increment for time-based data.
Access the reference page to see the descriptions of all available configurations.
Page and Information Visibility Settings
This category includes settings that manage the visibility of various elements and information on the web pages. It controls whether headers, legends, site information, and detailed views of groups, KPIs, charts, and tables are displayed. It also manages the visibility of links, tooltips, and empty groups.
Access the reference page to see the descriptions of all available configurations.
KPI Settings
KPI Settings configurations determine how KPIs are displayed and managed on the site. This includes settings for override indicators, recently changed statuses, status history duration, display of limits and targets on trends, and handling non-numeric limits.
Access the reference page to see the descriptions of all available configurations.
Group Map Settings
Group Map Settings control the display and behavior of group maps. This includes the number of KPI cells displayed, header behaviors, color settings for recently changed statuses, and the group map's default expansion state.
Access the reference page to see the descriptions of all available configurations.
KPI Block (Widget) Settings
These configurations manage the display of KPI blocks or widgets. Settings include the display of sparklines, bullet charts, status history charts, statistics, actions, and contact information on KPI blocks, simplifying blocks with missing data.
Access the reference page to see the descriptions of all available configurations.
Time Range / Event Range Settings
Time Range and Event Range Settings control the availability and display of predefined and query-based time ranges on range pickers. This includes settings for displaying OSIsoft AF Event Frames and which sections are expanded by default.
Access the reference page to see the descriptions of all available configurations.
Comment Settings
Comment Settings configurations manage how comments are handled within the system. This includes enabling comment codes, setting labels for different comment types, and enabling point-based and range-based comments.
Access the reference page to see the descriptions of all available configurations.
Calculation Settings
These settings control how Visual KPI systems handle calculations. This includes handling non-numeric values, substitution values for string results in calculations, and the behavior of status calculations.
Access the reference page to see the descriptions of all available configurations.
Watchlist Settings
Watchlist Settings determine the default view and attribute grouping for Watchlist KPIs. These configurations ensure that the Watchlist is displayed consistently and usefully.
Access the reference page to see the descriptions of all available configurations.
Security Settings
Security Settings manage access control and security-related configurations. This includes setting Windows Security Groups for all-access and admin rights and controlling outbound requests.
Access the reference page to see the descriptions of all available configurations.
Light & Dark themes
By default, Visual KPI sites have a white background, which is the light theme. However, you can add a dark theme to reduce on-screen glare in environments where a black background would make more sense. In the Website configuration worksheet, find the attribute for Default Color Theme. Under the column Value, use the pull-down menu to select the light or dark theme as the default.
In addition, to choose the default theme, you can enable users to change between them. For the attribute Allow Users to Change Color Theme, select TRUE to allow, and FALSE if you don't want to enable this option. If you set TRUE, Visual KPI site users will see the option to toggle between light and dark themes under the Options icon.
Timestamp display
Visual KPI shows your data in near real-time. The timestamp display in the top bar of Visual KPI sites shows you the exact time, down to the second, that the currently viewed data was returned. You can choose to display the timestamp based on the server or client time, even if the server and Visual KPI client are in different time zones.
Use Allow Users to Change Client Display Time and Default Client Display Time settings to define if users can change the display time and the default display time for your users. By default, the timestamp display in Visual KPI sites is set to Client Time, the time indicated by the device on which you access the Visual KPI client. If the timestamp is set to Server Time and your server is, for instance, set to New York time, the timestamp in Visual KPI will show New York time.
KPI status
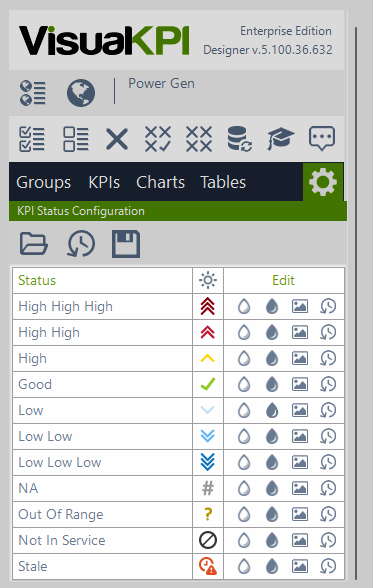
The KPI status configurations enable you to define each existing status's colors, icons, and custom names and abbreviations. In addition, if your company needs customized status, you can update the existing defaults or customize one of the Custom Status available. You can change anything and everything.
Access the KPI Status reference page to see the description for each available configuration.
When you access the KPI status worksheet, you will notice that a new panel with all statuses is available in addition to the available configurations in the worksheet. You can use this panel to configure each one of the existing KPI statuses:
- Light/Dark themes (/): Toggle between light and dark themes by clicking on the icon to preview the status icons.
- Pick the light theme color (): Pick the color for the status when the system is using the light theme.
- Pick the dark theme color (): Pick the color for the status when the system is using the dark theme.
- Reset (
 ): Return the status to the Visual KPI default configuration.
 - Change icon (
 ): Change the icon for the selected status.

You can perform the above configuration through the worksheet as well. In addition, the worksheet allows you to enable a status as a filter, include it in roll-ups, and enable it as an alert. When you define statuses as alerts, you can configure the alert behavior. See Alert Templates for additional information.
Chart colors
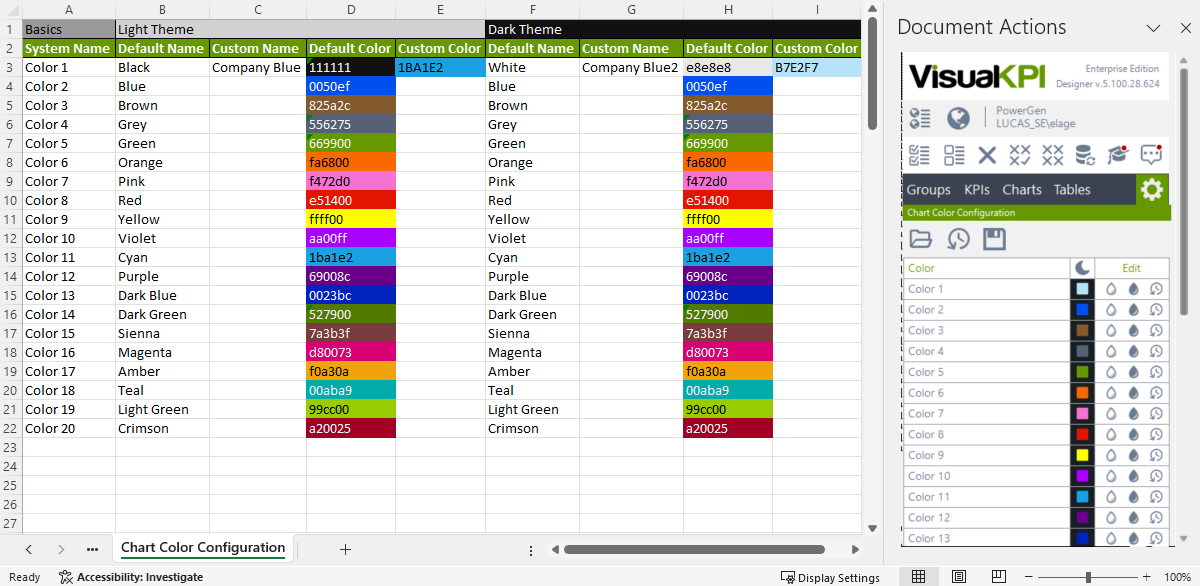
Visual KPI automatically adds default colors to charts. Using Visual KPI Designer, you can configure these chart colors, replacing the defaults with any color.

To customize a chart color, you should use the right panel:
- Select the light or dark theme (/) to visualize the current color.
- Click on the color selector for the corresponding theme:
- Light theme ().
- Dark theme ().
- Select the desired color and click OK.
You can add a custom name for each color through the worksheet.
Access the Chart Color reference page to see the description for each available configuration.
When custom chart colors are added, they become the new default colors sitewide, overriding the original Visual KPI defaults. These custom colors will appear in the pull-down menu for all charts with a color or pen option. The chart colors will update with your new custom colors for existing charts that use default colors.
If you change any colors in the configurations, it is important to check the chosen colors for visibility on the light and dark themes.
Features
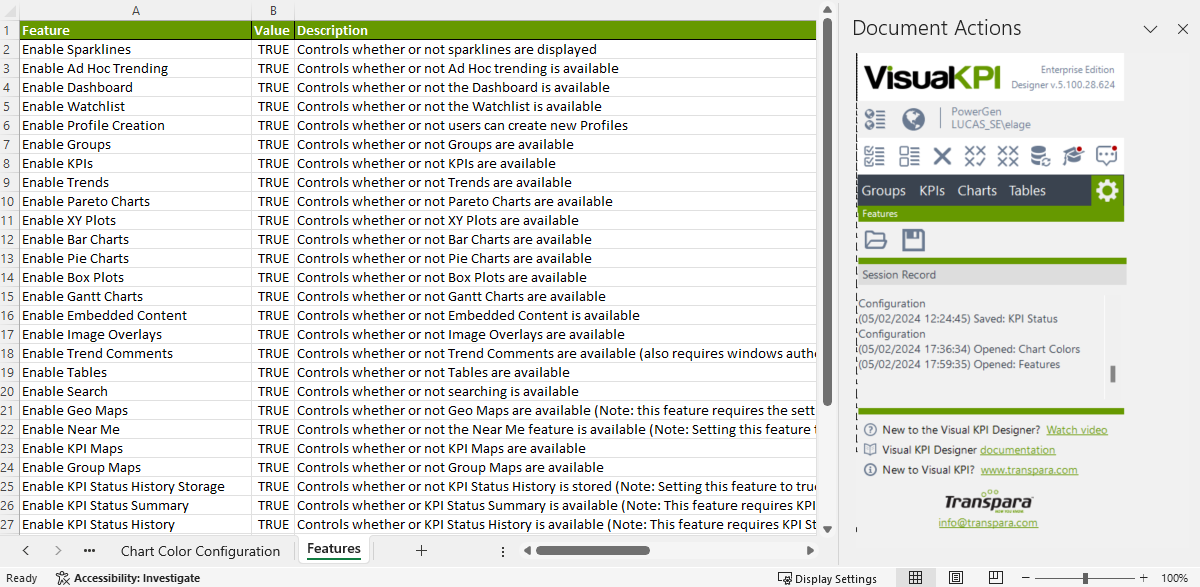
Use the Features configuration worksheet to turn on or off specific Visual KPI features sitewide. When disabled, they disappear entirely from your Visual KPI site. Almost all features are enabled by default, but you can change them by setting TRUE to enable or FALSE to disable.

Access the Features reference page to see the description for each available configuration.
Enable Site Roll-Ups allows you to include roll-ups of KPIs from across all websites, not just the one associated with this worksheet. You may want to enable this if certain executives need to see roll-ups of all sites company-wide. You may not want to allow this for any site that's only for operators of this one site.