Ranges & Dates
Visual KPI Designer enables you to configure standard time ranges and dates for use in Visual KPI's features. We set up some default time ranges that make sense for most of our clients, but you should feel free to change, add, or remove them as is best for your company.
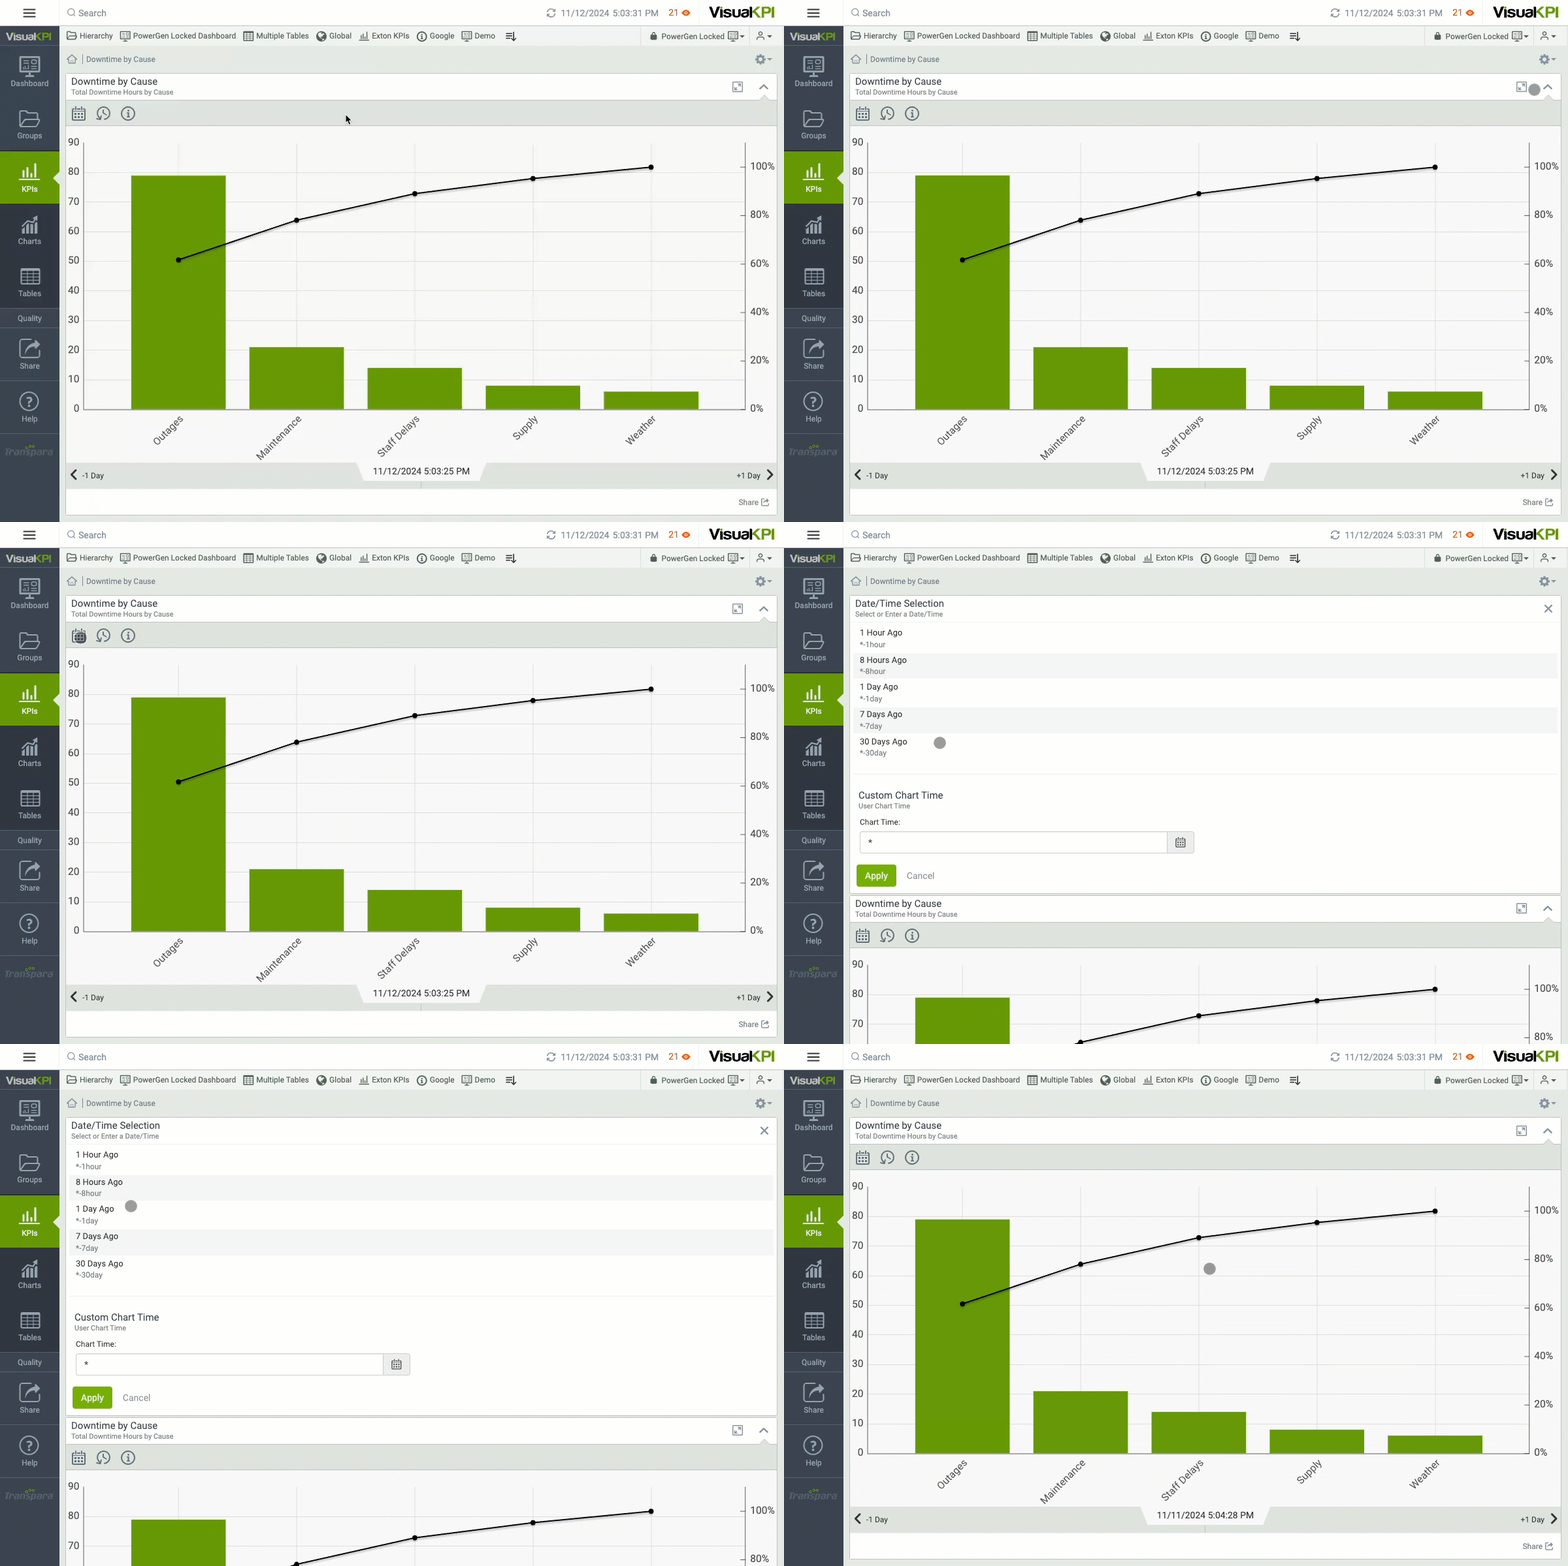
The Chart Ranges are the defaults that will appear whenever a user clicks to change the time range of any object on the site. The Chart Dates set the default name and dates that appear to your user for charts showing a single time point. The Default Ranges are for Trends and Sparklines. Event Ranges are the defaults for data retrieval queries, database time zones, and filter settings.
Chart Ranges
To set up Chart Ranges, go to the Settings icon (![]() ), Dates & Ranges, and select Chart Ranges. You will see the Chart Ranges worksheet. In it, you can change the Chart Range Name, the Display Order, Start Time, and End Time for the available ranges. For more information on each column, go to the Chart Ranges Reference Table.
), Dates & Ranges, and select Chart Ranges. You will see the Chart Ranges worksheet. In it, you can change the Chart Range Name, the Display Order, Start Time, and End Time for the available ranges. For more information on each column, go to the Chart Ranges Reference Table.
As you can see below, you can set up simple relative or actual dates as well as some fairly complex relative dates.
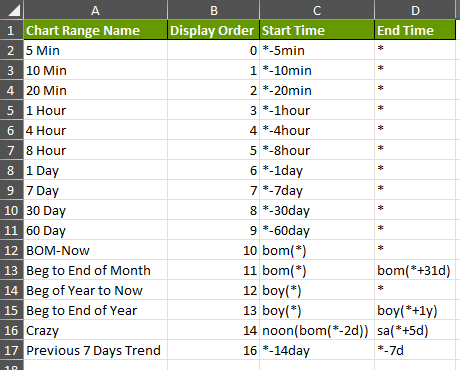
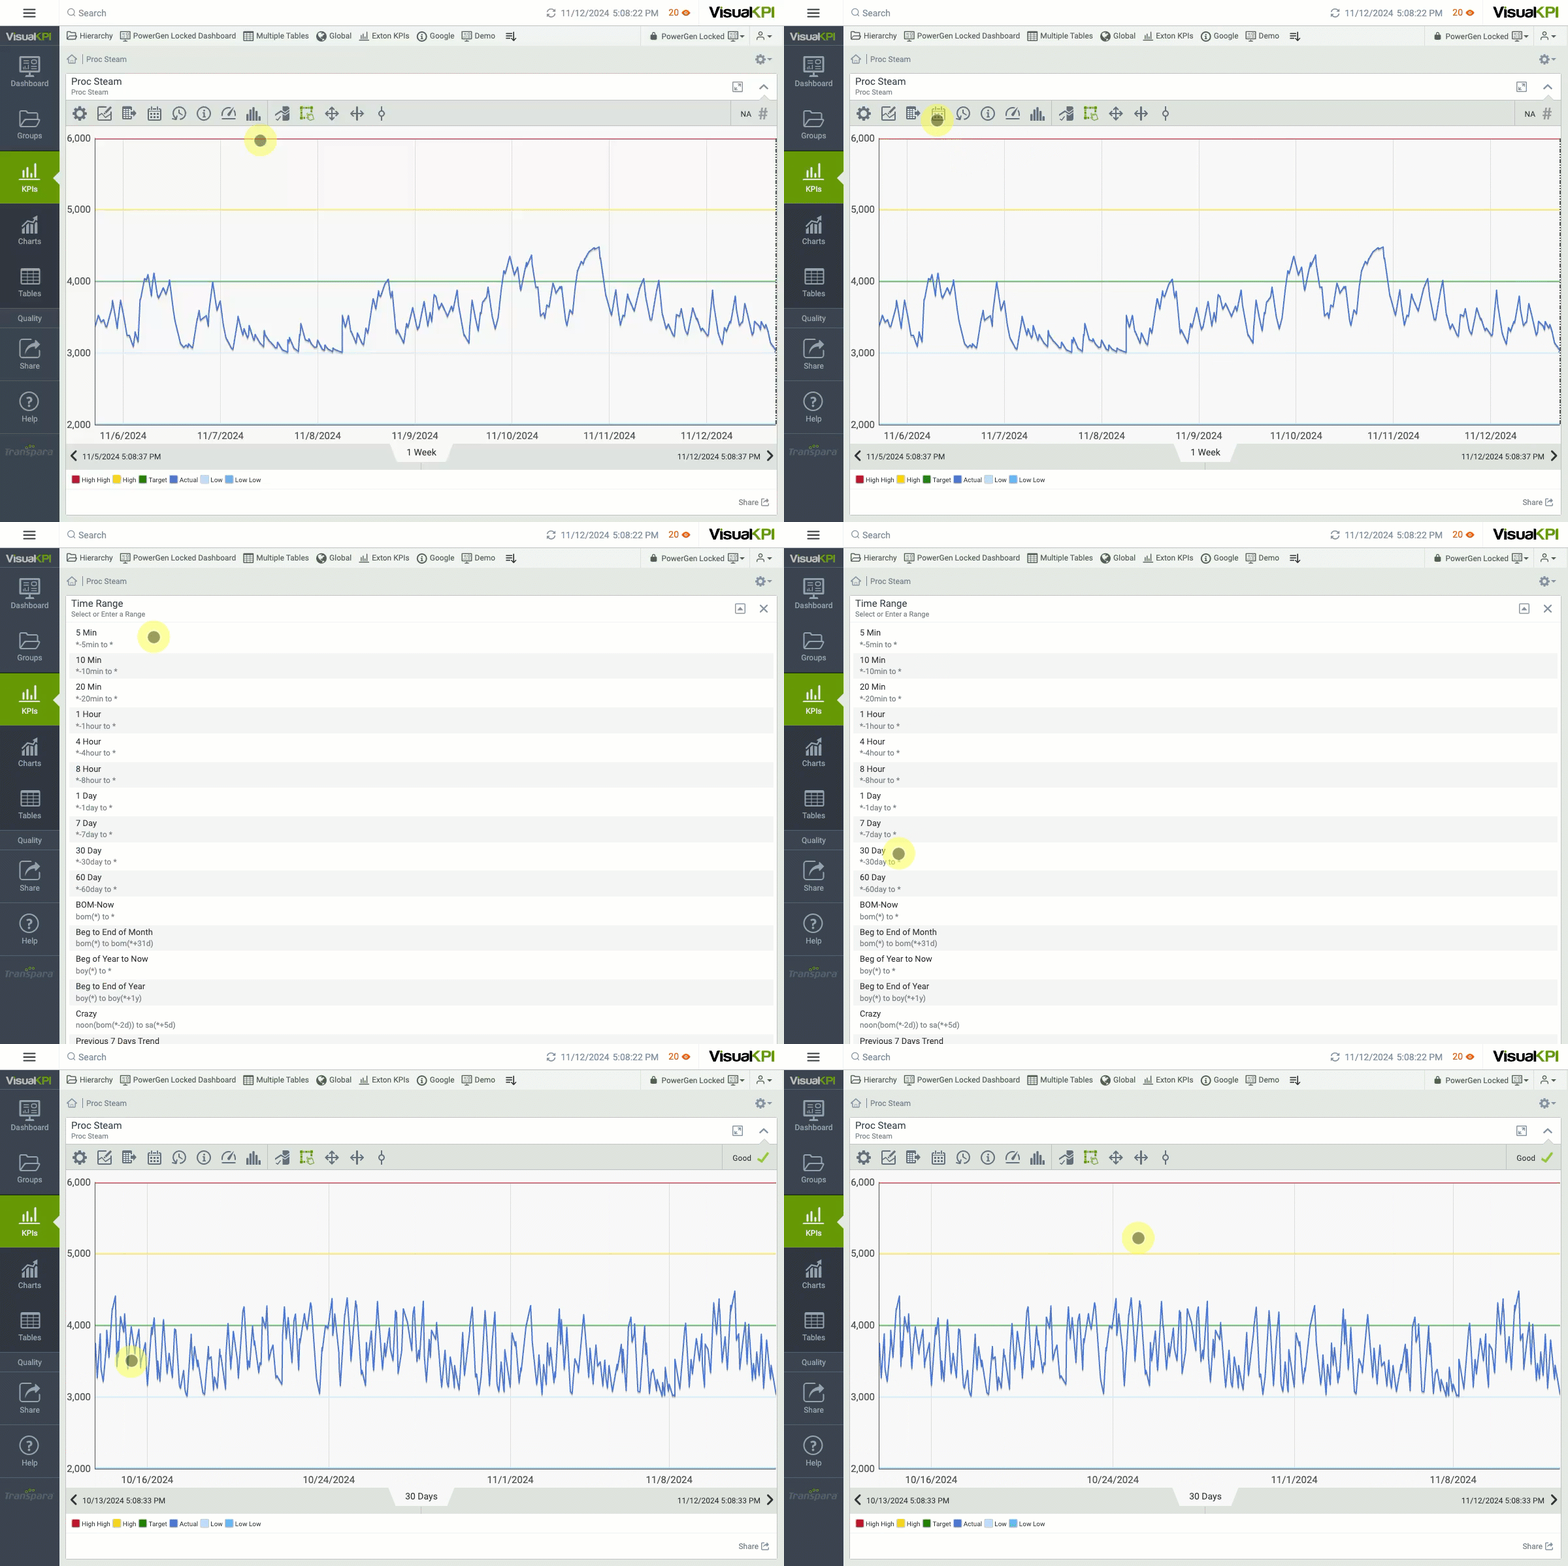
Chart Dates
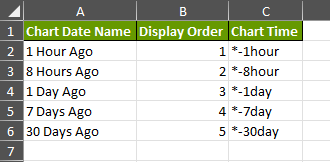
To view and change the Chart Dates, go to the Settings icon (![]() ), Dates & Ranges, and select Chart Dates. That will open the Chart Dates worksheet, where you can change the Chart Date Name, the Display Order, and Chart Time. For more information on each column, go to the Chart Dates Reference Table.
), Dates & Ranges, and select Chart Dates. That will open the Chart Dates worksheet, where you can change the Chart Date Name, the Display Order, and Chart Time. For more information on each column, go to the Chart Dates Reference Table.
The Chart Dates worksheet establishes the default dates users can select when viewing a chart that shows information for only a single day. Selecting another date will change the data that appears on the chart to the data of that chosen day.
Default Ranges
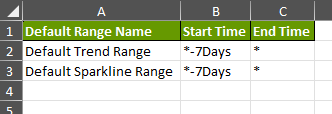
Go to the Settings icon (![]() ), Dates & Ranges, and select Default Ranges to view and change the Default Ranges. That will open the Default Ranges worksheet, where you can change the Default Range Name and the Start and End Time. For more information on each column, go to the Chart Dates Reference Table.
), Dates & Ranges, and select Default Ranges to view and change the Default Ranges. That will open the Default Ranges worksheet, where you can change the Default Range Name and the Start and End Time. For more information on each column, go to the Chart Dates Reference Table.
The Default Ranges worksheet sets the default time range that Trend and Sparkline charts will present when first opened.
Event Ranges
Go to the Settings icon (![]() ), Dates & Ranges, and select Event Ranges to edit the Event Ranges. That will open the Event Ranges worksheet, where you can change the Setting, Value, and Description. For more information on each column, go to the Chart Dates Reference Table.
), Dates & Ranges, and select Event Ranges to edit the Event Ranges. That will open the Event Ranges worksheet, where you can change the Setting, Value, and Description. For more information on each column, go to the Chart Dates Reference Table.
The Event Ranges worksheet lets you customize time ranges for data retrieval queries, database time zones, and filter settings.
