Search
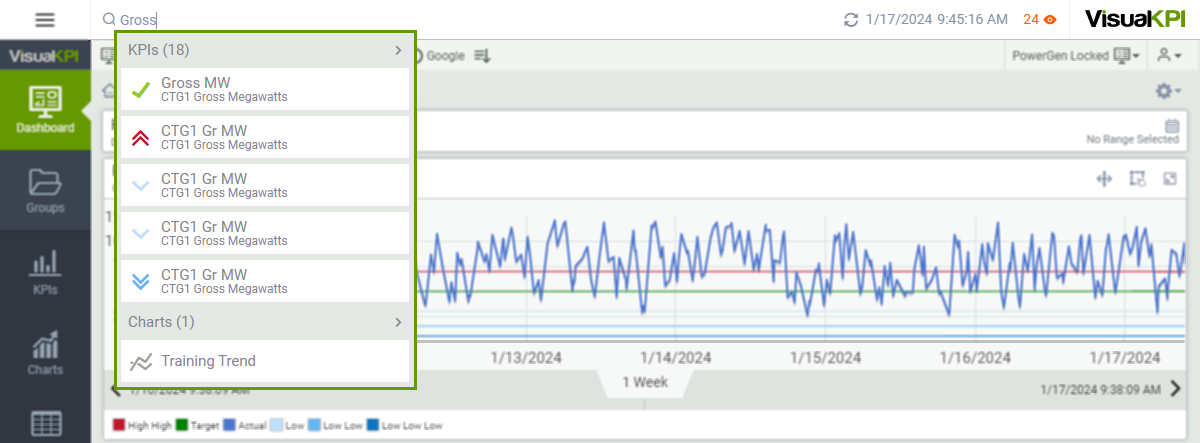
Visual KPI's Search feature allows you to search any object within your Visual KPI, including dashboards, KPIs, groups, charts, and tables. When you perform a search, Visual KPI will use different information depending on the object type to provide the search result:
- Dashboards: name and description.
- Groups: name and description.
- KPIs: name, description, and actual lookups (tags, equations, etc.).
- Charts: name and description.
- Tables: name and description.
- Trends: pen names and pen lookups.
The search feature is live, meaning live results will be displayed below the search bar as you type. The Visual KPI search feature shows you the top 5 search results within each object type and the live status of each one. If you need to do a quick search on the status of a KPI, you can enter the name of the KPI in search and see the status in the results.

Search in Specific Objects
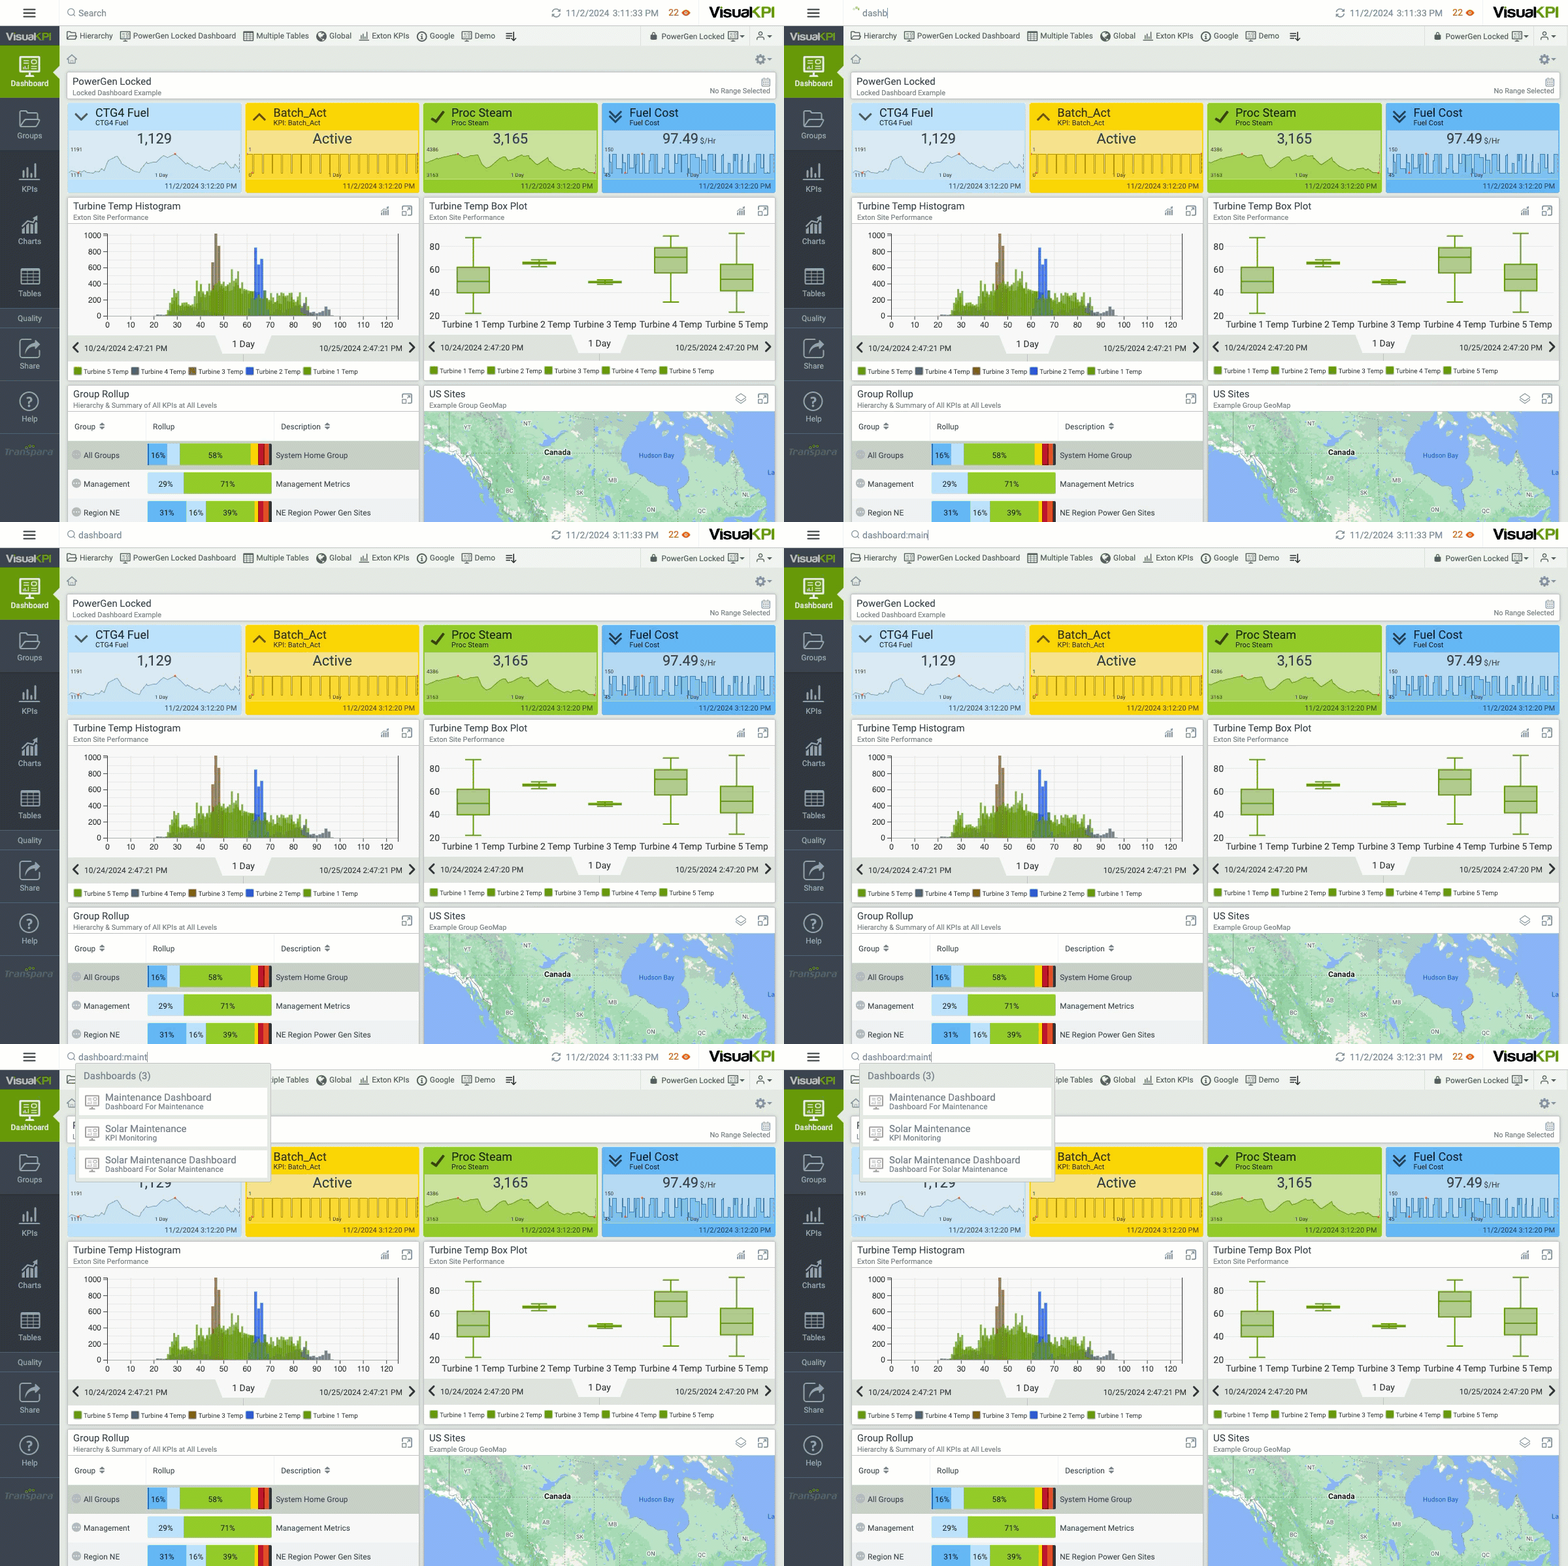
If you wish to search for something in a specific type of object, you can do so by searching by the type of object, a colon, and what you are looking for. For example, searching for dashboard:maintanance, you will find all dashboards with maintanance in their name or description.

Create Ad Hoc Groups
Ad Hoc is a trend type you can create by combining different KPIs. You can use the Search feature to find related KPIs and then create Ad Hoc based on the results. This way, you have a straightforward approach to visualizing related content.
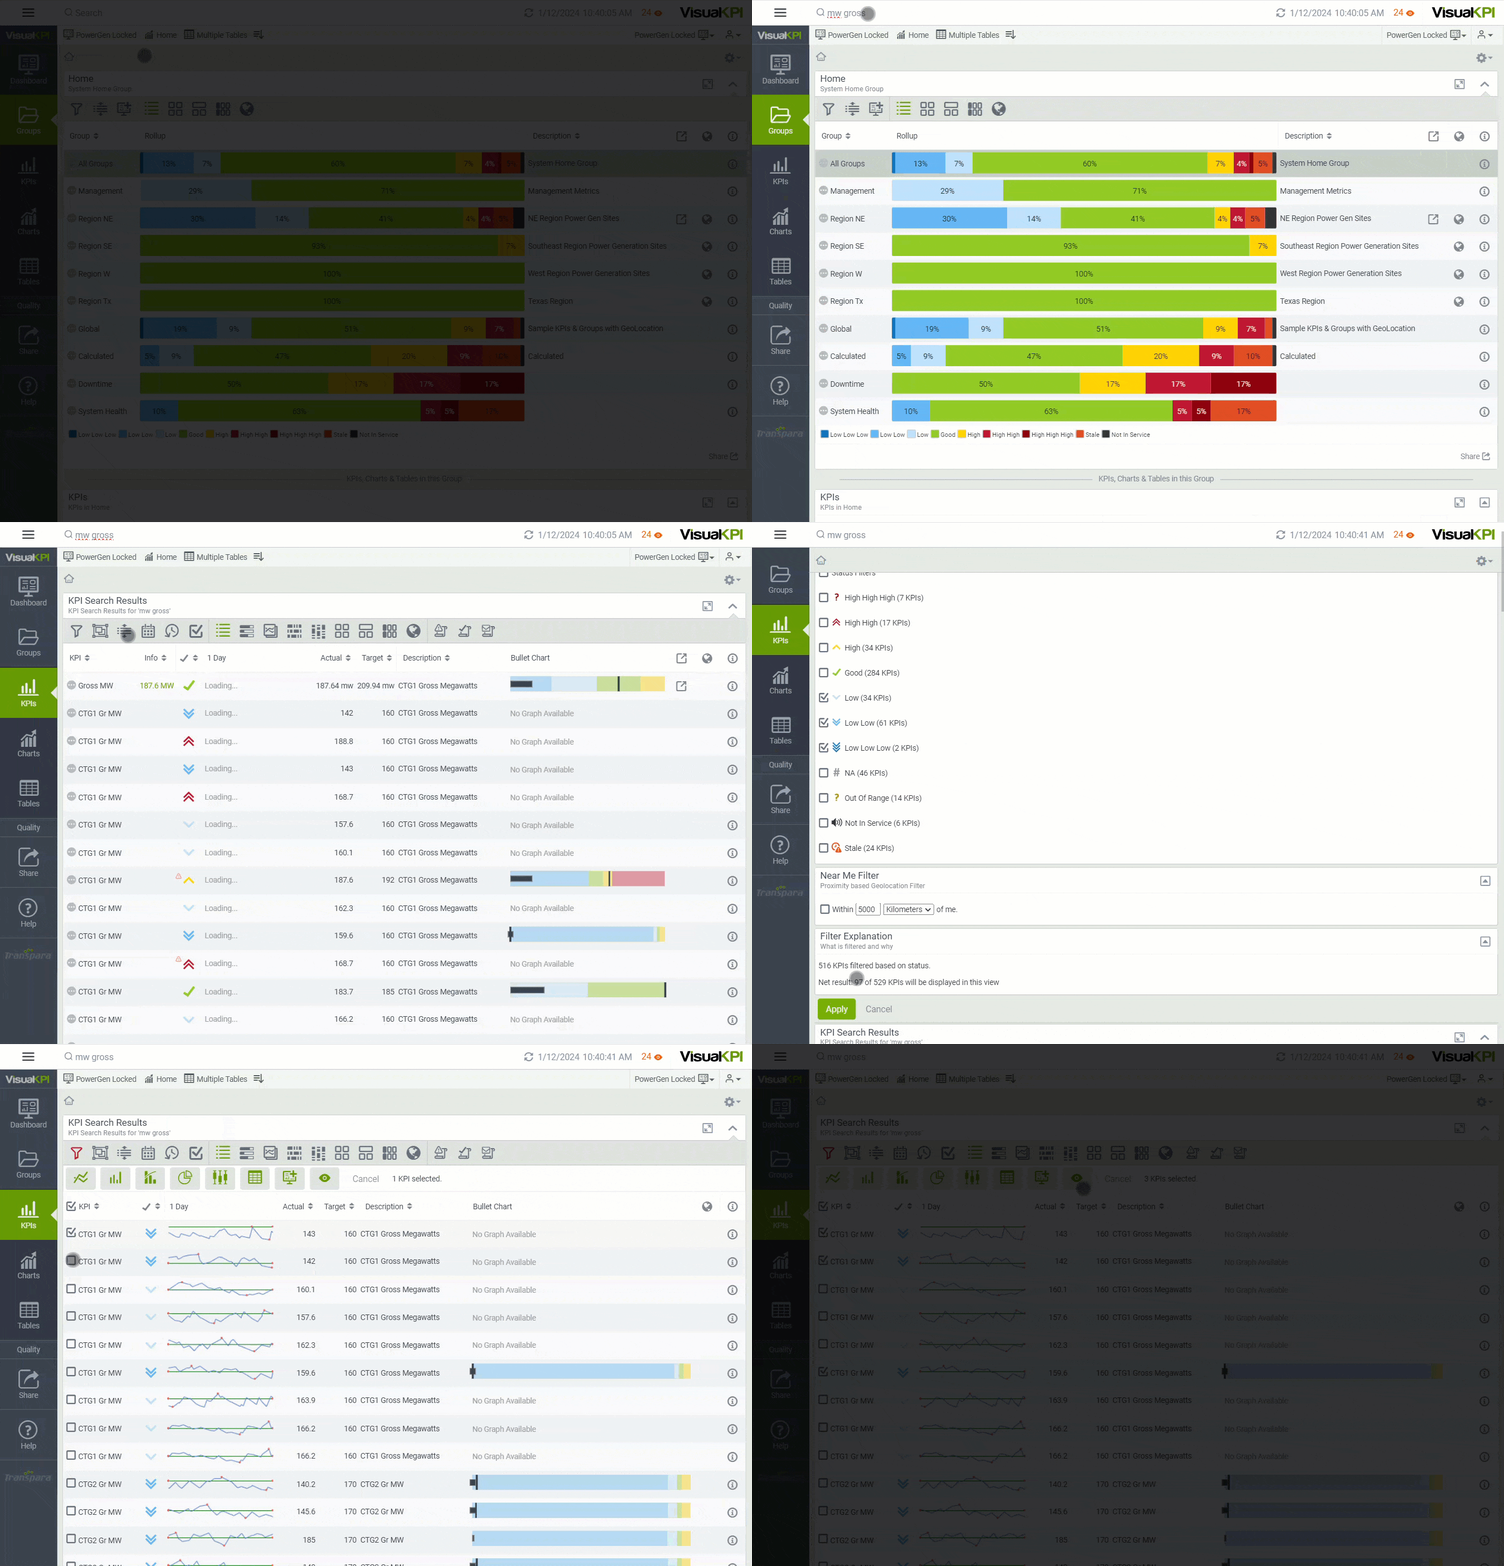
To create an Ad Hoc, follow the steps below:
- Search for the desired term using the Search Bar.
- Click an object type to see all results that include the parameter you entered. For this example, consider you choose the KPIs option.
- All objects related to your search will be displayed. Click on the Select KPIs ().
- Select all KPIs you desire to include in the Ad Hoc. You can select up to 20 items.
- Choose one option to visualize the Ad Hoc group:
- Trend ()
- Bar Chart ()
- Pareto Chart ()
- Pie Chart ()
- Box Plot ()
- Table ()
In addition to the options listed in Step 5, you also have the option to add the selected KPIs to the Dashboard () or add them to the Watchlist ().

Learn more about the search engine by watching the Search lesson in our End User Visual KPI training.
What's next?
Check the Analytics Visual KPI provides.