Group Maps
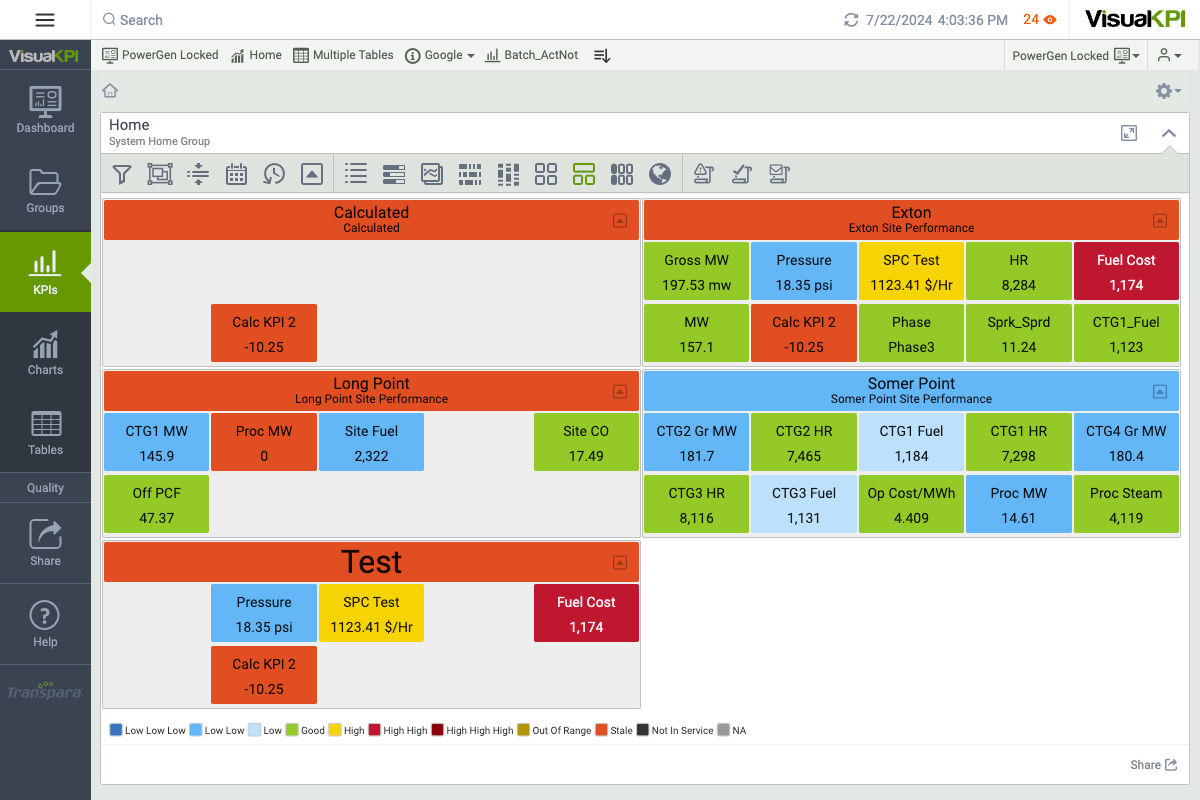
The Group Map view in Visual KPI is another powerful visualization that has several distinct benefits:
- When enabled, it gives Groups a live status and colors like a KPI typically has.
- It shows up to 20 KPIs in each Group in a fixed position (e.g., the temperature can always stay in the upper right), so users get used to their location regardless of screen size or device.
- Groups can be collapsed, individually or all at once, so you only need to open them when they need your attention.

In a Group Map, the group status is determined by your settings in Visual KPI Designer. The group status is based on the status of the most recently changed KPI in the group or the worst performing KPI in the group. The top bar, the Group Map header, displays group status (color and icon, depending on settings).
Use the Visual KPI Designer or Remote Context Server to configure Group Maps. Here are some of the settings you can (and, in some cases, must) configure (using the Designer as the example):
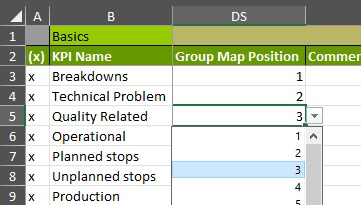
- [Required] Determine which and how many KPIs appear in a Group Map, including their Group Map Position.
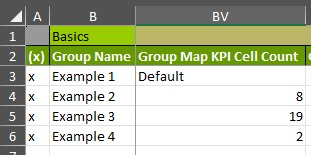
- Determine the Group Map cell count (how many KPIs will show in each group), as a site-wide setting or on an individual group basis.
- Choose Group Map Header Priority as a site-wide setting or individual group basis.
To display and configure Group Maps, you first need to set up Groups (the hierarchy). KPIs can be in groups dynamically or in a static state. Learn more about how to Create & Configure Groups.
Customize Global Settings for Group Maps
Visual KPI Designer has default site-wide settings for Group Maps. You can leave them alone and select and position your KPIs, or you can change the global settings.
To access global settings for Group Maps:
- In Visual KPI Designer, go to the Site Settings icon (
 ) in the Document Actions panel.
 - Select Features & Config → Website to open the worksheet.
- Roll down and you'll see the Group Map Settings section.

Available Global Settings
The Group Map Settings provides key configuration options for Group Maps, allowing you to customize their appearance and behavior. Below is a breakdown of the available global settings and their functions.
- Default Group Map KPI Cell Count: Specifies the number of KPI cells displayed per Group Map page (range: 1-20).
- Default Group Map Header Priority: Determines the Group Map header behavior based on priority: Overall, Recently Changed, or Custom Colors.
- Recently Changed Color: Sets the header color for Group Maps when one or more KPIs have been recently updated.
- Not Recently Changed Color: Sets the header color for Group Maps when no recent KPI changes are present.
- Group Map Fit to Page: A TRUE/FALSE setting to control if the Group Map is automatically resized to fit the page.
- Default Group Map Expansion Setting: Controls whether the Group Map is collapsed or expanded by default.
- Group Map Header Severity: Defines how the system calculates the severity of a Group Map header based on System or Display Order.
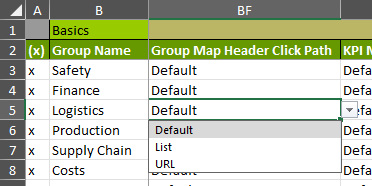
- Default Group Map Header Click Path: Configures what happens when a user clicks the header: it can either lead to a List or a URL.
Select and Position KPIs in Group Maps
Once you configure Group Map settings, you need to choose KPIs and their positions for the Group Map.
By default, Visual KPI shows 10 KPIs in each group for the Group Map view, but you need to give them a position to show up. You could have 100 KPIs in a group, but if you identify a position for five of them, you'll only see five. The other positions will be empty. You can override the KPI cell count on an individual group; more on that later.
- Open a KPI worksheet from the KPIs tab (
 ).
). - Select the group level that contains the KPIs you want to position in the Group Map.
- Scroll right on the worksheet to find the Group Map Position attribute column. For each KPI you want to include in the Group Map, set the position you want it to appear (left to right, top to bottom) within the Group Map.
If you don't select and position KPIs, your Group Map will not appear on your Visual KPI site.

For instance, if a Group Map has 2 KPIs you can set the default cell count to 2, and then select and position two KPIs for each group. Regardless of the order in which the KPIs are listed in the KPI worksheet, you set the positions in the order that works best for your situation.
Override Default Group Map KPI Cell Count
By default, Visual KPI will display 10 KPIs in a Group Map. You can change the setting globally in Site Settings, but you can also override the global setting for an individual group.
- Open the Groups worksheet from the Groups tab.
- Select the group you want to override.
- Find the name of the group in the worksheet, and then scroll across the page to find the override setting for Group Map KPI Cell Count in the attributes column headers.

In the Group Map KPI Cell Count attribute column, change or add a number to indicate the number of KPIs you want to display in the Group Map for the group you've just selected.
Override Default Map Header Click Path
By default, Visual KPI will display a list when the user clicks on a group map header. You can change the global setting in the Global Settings, or you can use a group override.
- Open the Groups worksheet from the Groups tab.
- Select the group you want to override.
- Find the name of the group in the worksheet, and then scroll across the page to find the override setting for Group Map Header Click Path in the attributes column headers.
