KPIs
When you create and configure KPIs in Visual KPI Designer, the new KPI data is uploaded immediately to the KPI database and appears live on your site. You can define attributes for new KPIs by entering data directly into the cells in the KPI worksheet or by copying and pasting an existing KPI row into a new KPI row. You can also return data for your KPIs via connected interfaces and add functions and formulas, including relative time functions, that allow you to capture and display data in almost any way you can imagine.
Create a new KPI
To create a new KPI, select the KPIs tab, click the New KPI icon (![]() ), and enter a name for the KPI. Then, you can click:
), and enter a name for the KPI. Then, you can click:
- Apply to add the new KPI and its default settings to the KPIs worksheet and continue adding KPIs.
- OK to add the new KPI and its default settings to the KPIs worksheet and close the dialogue.
- Cancel to cancel the creation of the new KPI.
Once you click the Apply button, the KPI(s) already added to the KPIs worksheet will not be removed.
If you have a worksheet with KPIs open and want to remove all KPIs from the current KPI worksheet, select the Replace worksheet contents checkbox (any unsaved changes are lost). This will also remove the existing KPIs from your site.
Define KPI attributes
Use the attribute fields (columns) on the KPI Worksheet to define your KPI. To save, place an x in the first column and click the Save icon (![]() ) in the open KPI tab of the Objects Toolbar. It is important to note that all KPIs with an “x” in the (x) column will be saved. You can remove the x for any KPI you don't want to save or update. See the list of all possible KPI attributes in the KPI Attributes & Keyword Reference.
) in the open KPI tab of the Objects Toolbar. It is important to note that all KPIs with an “x” in the (x) column will be saved. You can remove the x for any KPI you don't want to save or update. See the list of all possible KPI attributes in the KPI Attributes & Keyword Reference.
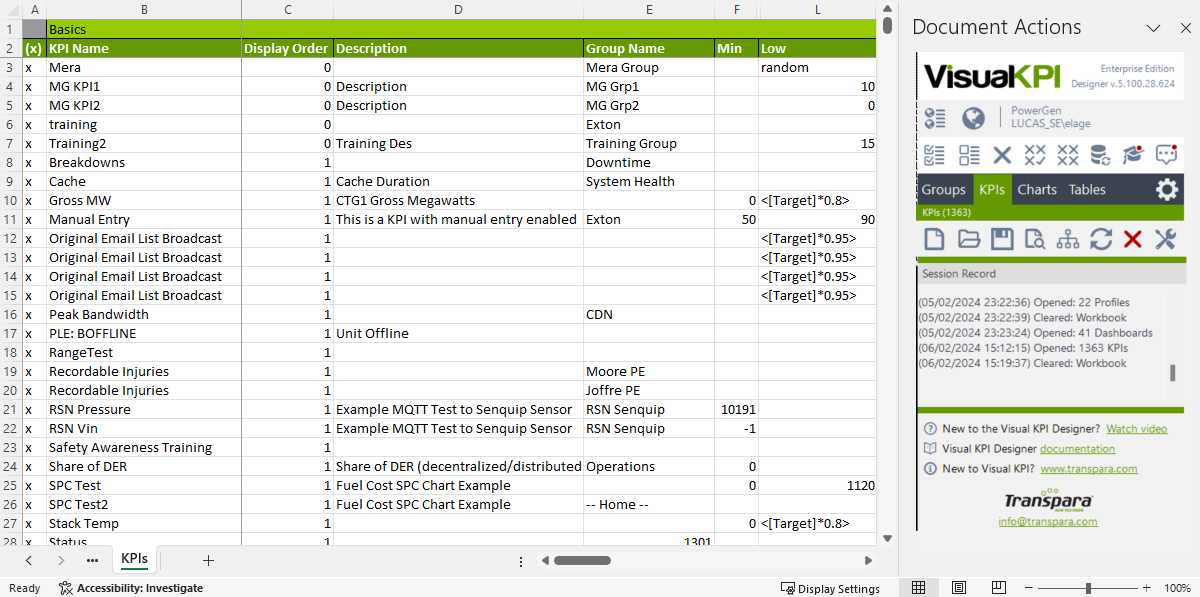
Basic attributes
There are many attributes that you can explore. You can learn about them on our KPIs Attributes & Keywords Reference page. Some of the basic attributes are presented below.
You can find more details about the Info Column in the Info Column section.
KPI visualization on the Visual KPI Site
Define the order in which the KPI will be listed on the KPIs screen on your Visual KPI site with the Display Order attribute. Using the Description column, you can define what will be displayed on the KPI page on your Visual KPI site. It can be a description of the KPI, a URL to any Web page, a tag name used to retrieve data from an external system, or an attribute formula or function.
If you want a KPI to be displayed on the Visual KPI site, select TRUE from the Show column list. Otherwise, choose FALSE. However, if you want Visual KPI to determine at run-time if the KPI should be displayed, use a tag name or an attribute calculation instead of True/False. If you use a tag name for the Show attribute, you must specify the interface in the Show Interface column. Any non-zero value for Show indicates the KPI will be displayed on your Visual KPI site.
To add a KPI to a single Group, select the Group Name from the list of already defined groups. If you prefer that KPIs in Groups be determined at run-time, it is best to build a query to create a Dynamic Group. The Home group is the Home page for Visual KPI.
To retrieve the value from an external system, specify a tag name in the Actual column and specify the interface name in the Actual Interface column.
What's next?
Learn more about Using Values from Multiple Data Sources on KPIs.