Tables
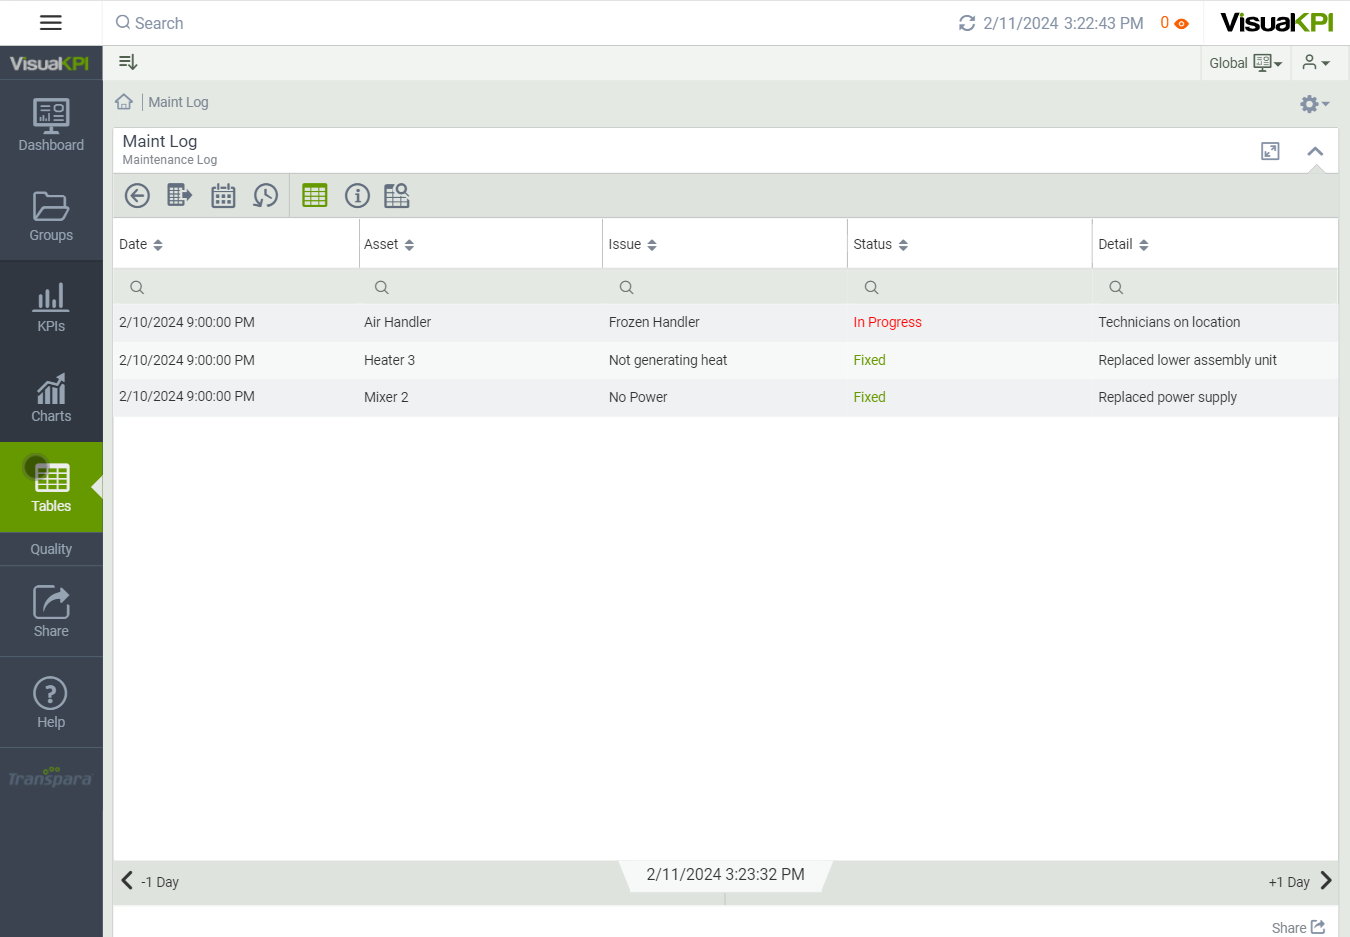
Use the Tables Object Tools in the Visual KPI Designer to create and edit tables for your Visual KPI sites. Tables can be viewed in Visual KPI sites from the Tables tab in the main navigation menu.

You can visualize data in a table, such as a maintenance log, shift report, or a log of truck materials and delivery times. You can create and configure tables using static values or return data from an interface.
Use Visual KPI Designer to return data from any table in an SQL-based data source (SQL Server, Oracle, MySQL, Excel, Access, and more). Tables can include links to relevant data, such as trends. Additionally, you can add geolocation to tables to display the location of listed assets. Using connected interfaces, you can also show the geolocation of moving assets.
While tables have some limitations, you can add functions and formulas, including relative time functions, that allow you to capture and display data in almost any way you can imagine.

Create a new table
To create a new table, follow the steps below:
- Select the Tables tab and click the New Table icon (
 ).
). - Enter a name for the Table.
- Add the new Table using one of the following options:
- Click Apply to add the new Table and its default settings to the Tables worksheet and continue adding Tables.
- Click OK to add the new Table and its default settings to the Tables worksheet and close the dialogue.
- Click Cancel to cancel the creation of the new Table. Once you have clicked the Apply button, the Table(s) already added to the Tables worksheet will not be removed.
If you have a worksheet with Tables open and want to remove all Tables from the current Table worksheet, select the Replace worksheet contents checkbox (any unsaved changes are lost). This will also remove the existing Tables from your site.
Define table attributes
Use the attribute fields (columns) to configure your Tables.
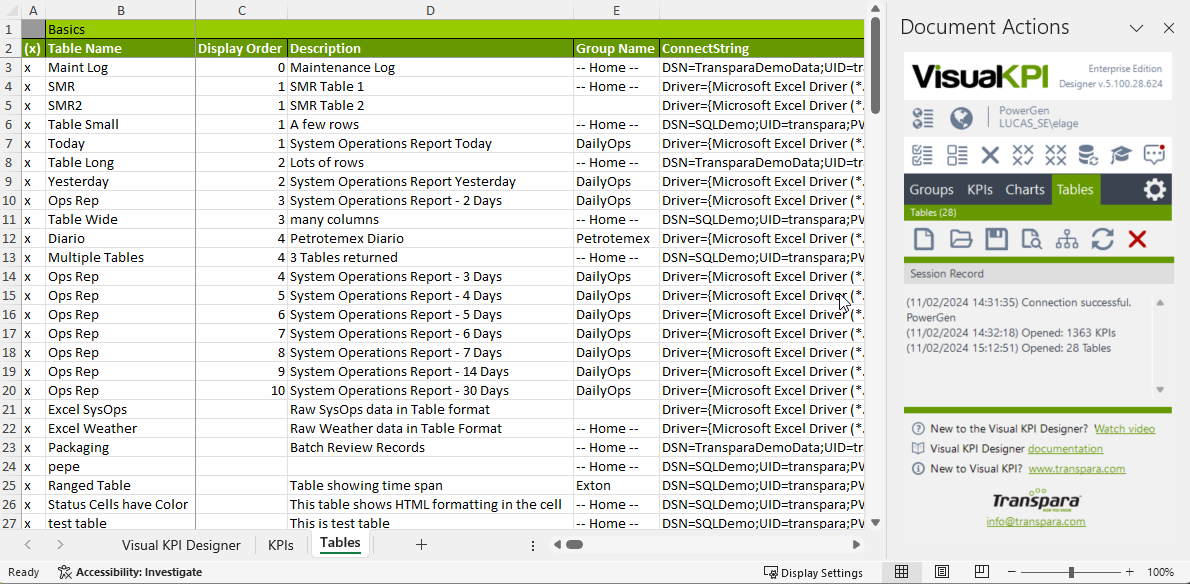
To save a Table, place an x in the first column and click the Save icon (![]() ) in the open Tables tab of the Objects Toolbar. it's important to note that all Tables with an x in the (x) column will be saved. You can remove the x for any Table you don't want to save or update.
) in the open Tables tab of the Objects Toolbar. it's important to note that all Tables with an x in the (x) column will be saved. You can remove the x for any Table you don't want to save or update.
See a full list of all possible Table attributes in the Tables Attributes & Keyword Reference.
Define display order
In the Tables worksheet, enter the Table's Display Order. This is the order in which the Table will be listed on the Tables menu on your Visual KPI site.
Tables with an assigned Display Order are listed at the top of the page in Display Order. Tables without an assigned Display Order are displayed in alphabetical order, following the Tables with an assigned Display Order.
Add a table description
Tables display a Description column, allowing you to add a simple description or other information users may need.
Add Table to a group
If the Table should only be included in a single Group, select the Group Name from the list of already defined groups. If you prefer that the Tables displayed in Groups be determined at run-time, it's best to build a query to create a Dynamic Group. The Home group is the Home page for Visual KPI.
Link to related information
Using the Info attribute column, you can add a link to a Trend, another table, a KPI or even external content. The Info column appears on the list of Tables in the main menu of your Visual KPI site.

You can find more details about this feature in the Info Column section.