KPI Trends
Any KPI can be viewed as a trend. Use Visual KPI Designer to set the KPI trend default attributes.
We say “default” attributes because users on Visual KPI sites can customize trends. For example, the start and end times you set in Visual KPI Designer are the default settings on your Visual KPI site. Users can select other time ranges to customize trends only in their view of the Visual KPI site.

Set Trend Start/End Times & Interface
If you want to specify the Start and End times for this KPI's Trends, enter the Start time in the Trend Start Time column and the End time in the Trend End Time column. If these values are left blank, the Trend graphs will use the Default Trend Range defined in the Default Ranges.
You can also use an interface with the start and end times. The start and end times will return data for the selected interface only for the start and end times selected.
Select Trend Type
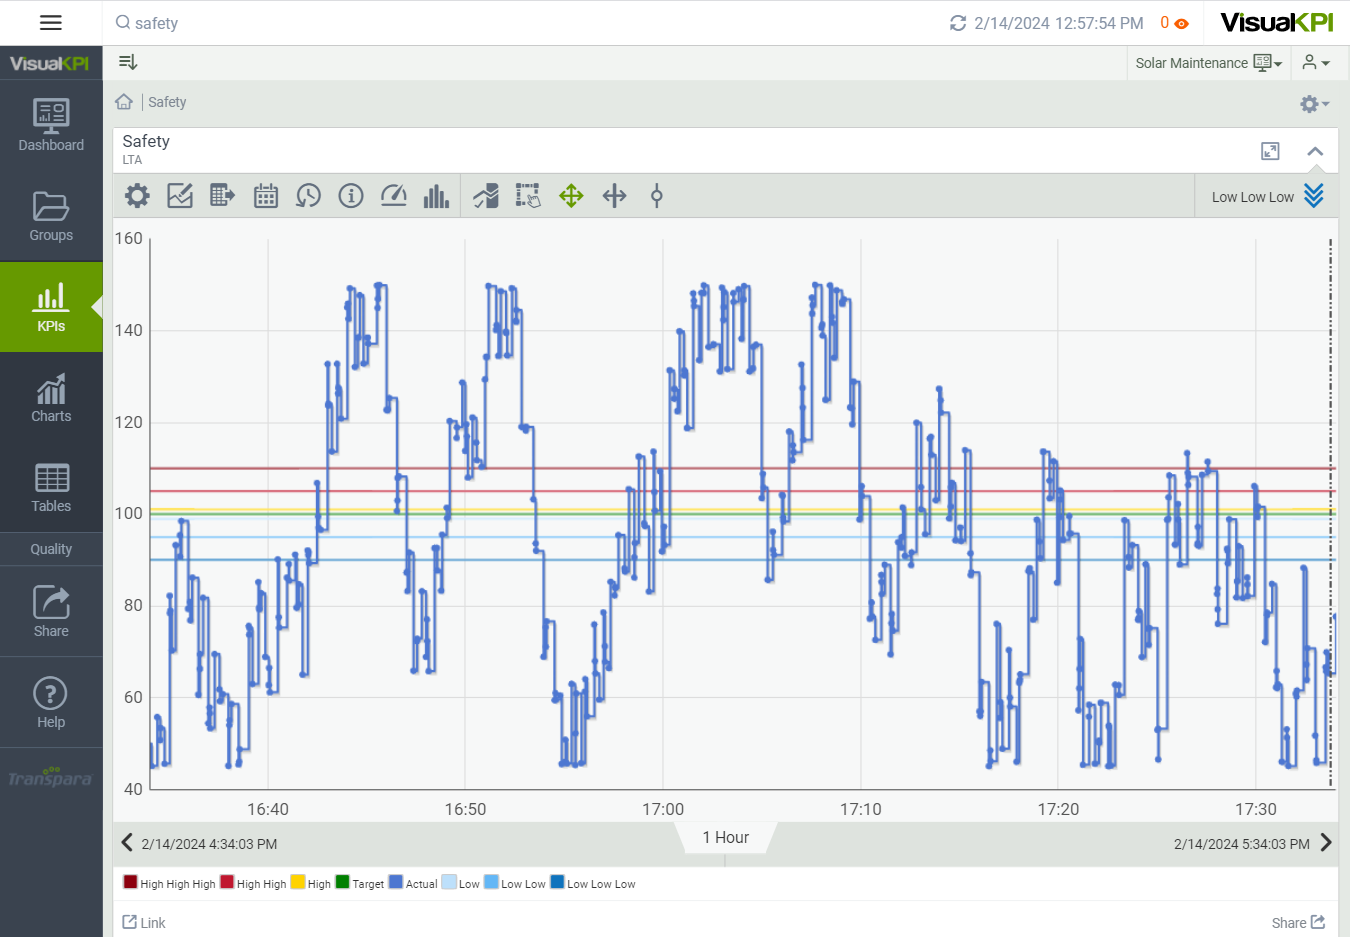
Select the trend type to be used as the line type for each of the pens on the KPI trend: Actual, Target, and Limit. You can select from Interpolated, Step, Symbol, Interpolated + Symbol, or Step + Symbol. If you leave this blank, the trend type will default to Interpolated.
From the Trend Scale pull-down list, select the type of trend to be used for the KPI. You can choose either Single-Scale or Multi-Scale. In Single-Scale mode, only the Target line indicator will be displayed. In Multi-Scale mode, all status indicator lines will appear in the trend.
Set Minimum and Maximum Values
In the Trend Y-axis, select TRUE if you want the Min and Max values ignored. The Y-axis will scale based on the trend values. Select FALSE to enforce the use of the Min and Max values for the Y-axis scaling.
Override Default Trend Lines Display
You can set a default behavior for showing (or not) the Target, Limits, and Average indicator lines within the trend. If you select Default for an individual KPI, the trend will display whatever you selected in sitewide settings as the default behavior for the entire site. If you want to override the default behavior for a KPI, select TRUE or FALSE from the pull-down menu. Whatever you choose as Default, users on your KPI site will still have the option to show or hide trend lines.
Show Status Background
We added a feature in Visual KPI sites that colors the background of a trend based on its status. This allows you to quickly see the trend's status over time without studying the data points and where they fall on the target and limits axes.
In Visual KPI Designer, you can configure the status background to show by default or not. Either way, users can toggle the status background on and off.
In the sitewide settings for KPIs (Features and Config/Website/KPI Settings/Show Status Background), set the default site behavior for the status background.
Select TRUE or FALSE for Show Status Background to override the default sitewide setting for an individual KPI.
