SPC KPI Configuration
SPC rules allow you to view trends and alerts on data to determine how in or out of control it is based on rules. For example, you have lab samples that need to be charted so you can see when something needs attention because it violates the acceptable control limit(s).
Visual KPI allows you to display SPC-based charts quickly and easily using the four most popular Western Electric rules without having to invest in complicated SPC software. While Visual KPI doesn't cover every possible function of SPC, it does allow you to set up your KPIs using SPC rules in just minutes, and you don't need extensive training or knowledge to apply the four most commonly used SPC rules to your KPIs.
Click the label of any of the four rules in Visual KPI Designer to open the link to the Western Electric rules and see a description of each of the four most common rules.
What is SPC?
Statistical Process Control (SPC) is a method for monitoring, controlling, and improving processes based on statistical analysis. It measures whether processes are within control limits.
You can use SPC rules to measure quality and productivity. Data is plotted on control charts over a time range using standard deviations and other statistics so you can quickly visualize and analyze it and see when a process is out of control and needs attention.
SPC contains a handy set of rules for defining control limits in cases where time values don't correlate. An example would be data collected from lab samples or tracking blood sugar results in diabetes patients.
By charting the data over time and using statistical decision rules, you can determine whether your process or data is stable or has variations that denote instability. You can see where improvements need to be made or take action in real-time with processes outside control limits.
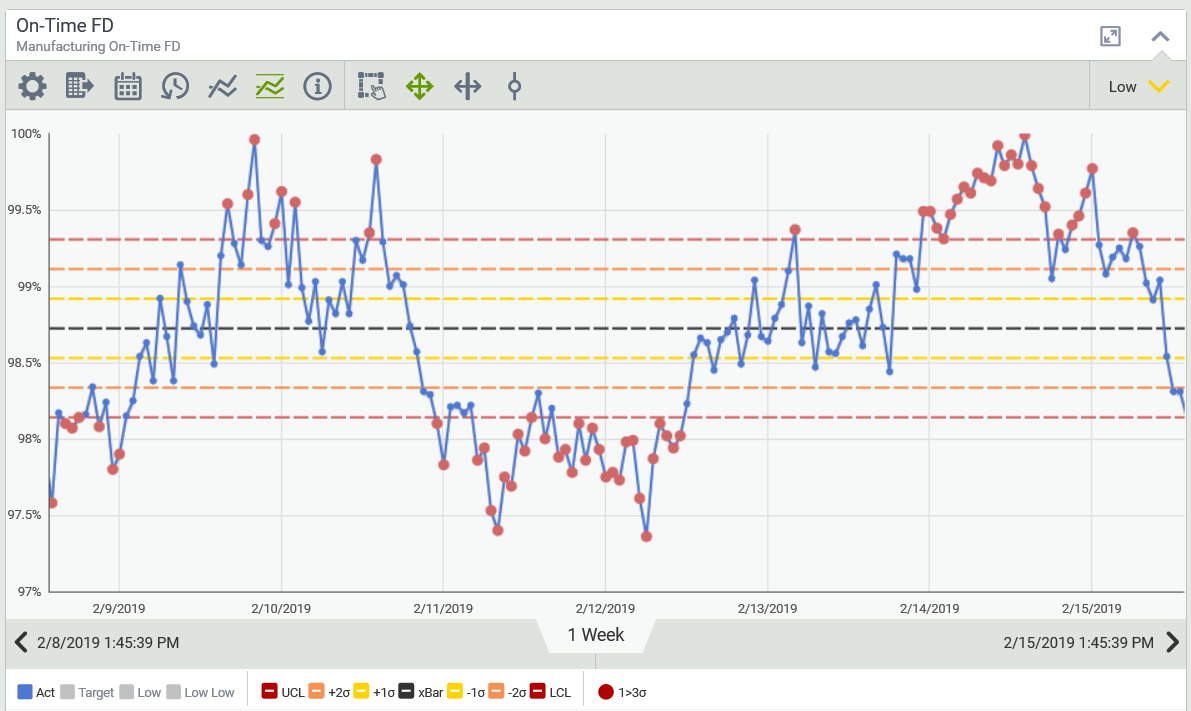
When you apply SPC rules, a KPI may be charted with a Center Line (control value or xBar) or at 1, 2, or 3 standard deviations.

How do SPC rules work in Visual KPI?
In Visual KPI, SPC is a type of trend, but its limits are set according to SPC rules. You can use Western Electric rules and enter data manually or use an interface to collect data and calculate and chart a KPI based on these rules. In Visual KPI Designer, you can configure KPIs using the four most common SPC rules.
When enabled for a KPI, users on your Visual KPI site will visualize the KPI as a line chart (trend) with a center line (control value) and upper and lower limit values representing violations. In other words, the chart can be used to see if data is not within control limits so someone can take action.
To use SPC rules in Visual KPI, all limits must be symmetric. Visual KPI does not manage asymmetrical control limits. Visual KPI is not a full SPC implementation system. It helps implement controls on uncorrelated systems in those rare cases you may need to do so.
Only enable this on KPIs that require SPC because the calculations add load to the system and unnecessarily increase your cache time.
Determining control limits in Visual KPI
Using the Visual KPI Designer, you control how to define SPC KPIs. You can go as straightforward or as complex as you want.
The Visual KPI Designer offers you three options for determining control limits:
- Let Visual KPI calculate control limits
- Define start and end time
- Define control limits
Define SPC control limits in Visual KPI
SPC is a feature that's bound to a KPI. In other words, you need a KPI first.
You can define a KPI using a name and actual value, and Visual KPI will do the rest. Usually, a KPI automatically enables a trend view, where you have time on the X-axis and value on the Y-axis. Limits can be defined via dynamic reference to an Interface, via a static value, or to nothing, where there is no limit.
To define control limits for a KPI using SPC rules, open Visual KPI Designer and find the SPC section of the KPI configuration worksheet. There, you can define SPC rules for any KPI.
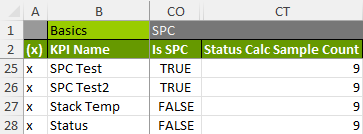
First, set TRUE or FALSE for Is SPC.
This tells Visual KPI whether this KPI will be displayed based on SPC rules or not. To enable SPC for that KPI, you must set Is SPC to TRUE. When the actual value you set for a KPI is used as an SPC, it will be treated according to the rules you define.
If you want, SPC KPIs can have standard KPI limits and a target in addition to the automatically calculated SPC limits. Users can toggle each of these on or off when viewing the trend.
Define a sample size
The sample size is the only setting required for defining control limits via SPC in Visual KPI.
The number you add to the Sample Count column represents the number of data points or samples you want to include to determine status (whether the group of uncorrelated samples is in control or not).
By default, the Status Calc Sample Count is set to 9 because, by definition, you need at least nine samples for SPC rule 4 (WE4). The larger your sample size, the slower the calculation will return a status, but a larger sample size also means a more reliable status.
Next, decide which option is best for determining control limits for your KPI.

Let Visual KPI calculate control limits
To let Visual KPI calculate limits for you, leave Start time and End time blank and leave the LCL, Centre Line, and UCL blank. Visual KPI will use the screen time range on the displayed chart to calculate control limits.
For example, if a user opens a one-week trend in the Visual KPI site, it will use one week of data to calculate the lower and upper limits and the center line.
Define start and end time
Enter start and end times to define control limits based on a time range. Ideally, when setting Start and End times, you want to use a time range when the process was under control. This time range will be used as a basis for control limits.
Start and End times in SPC work similarly to a regular KPI Start and End time. You have two options:
- Add a fixed date and time.

- Add a dynamic time using an Interface.

Define control limits
You can manually set control limits or return a control limit based on an Interface that returns values calculated outside Visual KPI.
After you've entered a Sample Count, define an SPC variable for a KPI.
Select one or more rules to apply. For each of the four available rules, you can ignore it or select which limit or status the rule will correspond to when it is violated.
Select a limit as the state to display, or choose a custom status.
The columns in Visual KPI Designer you use to set limits are:
- LCL: Lower control limit.
- Centre line: Control value that determines when data is not in violation.
- UCL: Upper control limit.
You can enter known values into the LCL, Centre Line, and UCL columns for each KPI to manually enter control limits.
To use an Interface to return values calculated in another system, select an Interface and enter the reference. The LCL, Centre Line, and UCL will be populated automatically on your Visual KPI site based on the calculation returned by the Interface.
If you need help setting up SPC rules for Visual KPI, contact us.
Video Guide
Check the following video if you prefer to watch and listen to the instructions.