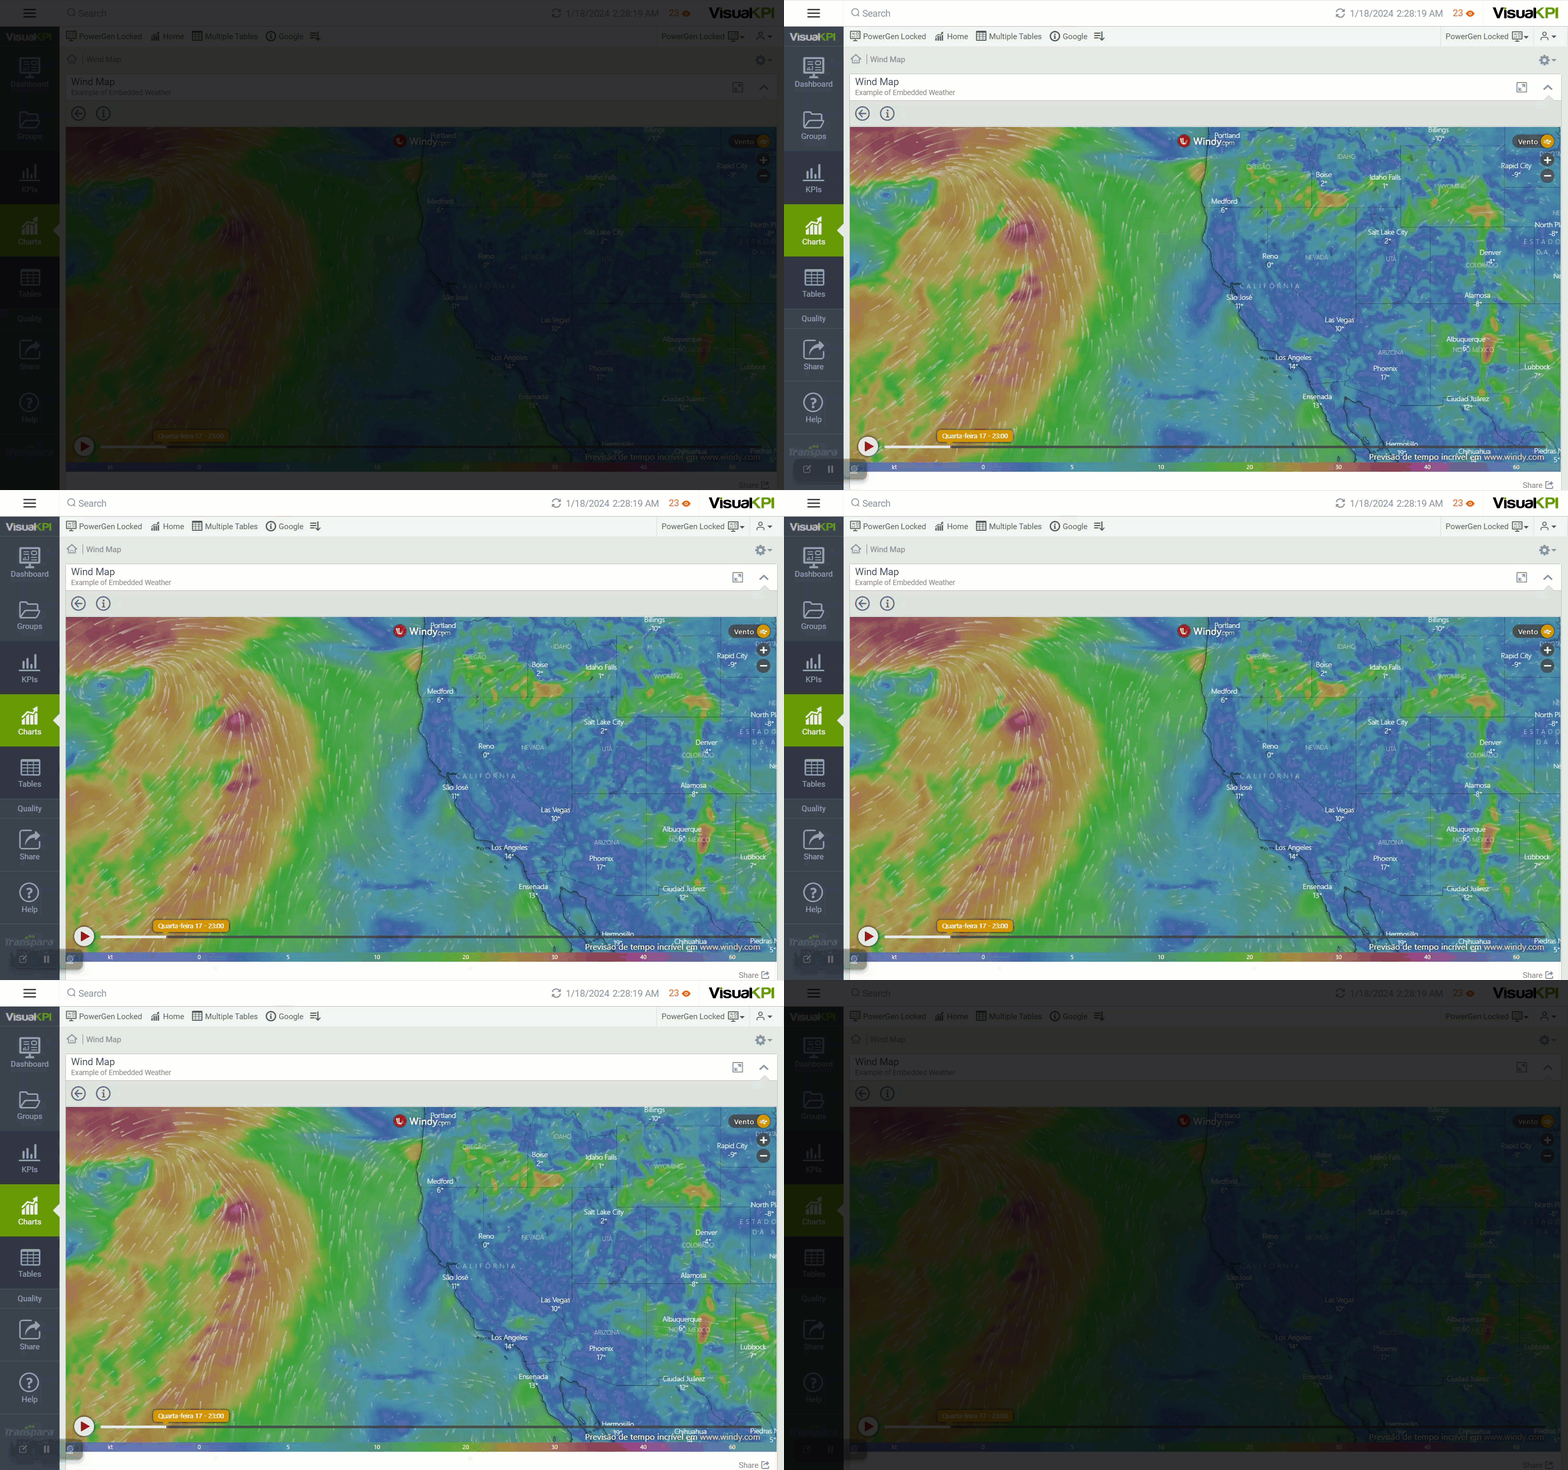
Embedded Content
Your admin can embed content from an external source in Visual KPI, such as a weather map, HMI or process graphic, live video feed, manual data entry form, and just about anything with a URL. These objects can be placed on your Visual KPI dashboards and be visualized as first-class objects within the system.
The external content you embed in Visual KPI can have attributes and geolocation, be in groups, or be at any level of the hierarchy, just like any other KPI or Visual KPI object. When you embed content in Visual KPI, you'll find it organized under the charts menu, Chart Type: Embedded Content ().

Embed Visual KPI into other applications
You can integrate any Visual KPI page or object into portals that support iframes by using the Visual KPI page URL. This lets you display real-time KPI data within your existing applications or dashboards.
To embed an entire Visual KPI page, you need to copy the URL of the page you want to embed. This URL will include the entire screen layout with the top navigation bar and sidebar menu.
You can also embed a specific object, such as a Geo Map. Use this option to restrict users from navigating away from the object or navigating to other parts of your Visual KPI site. To embed only an object into another application, follow the steps below:
- Navigate to the object you want to embed.
- Click on the expand icon (). Only the selected object will appear on your screen.
- Copy the URL, and add embed before the question mark ? in the URL, as in the example below:
- Paste the modified URL in your external portal or application.