Trends
Trends, or Ad Hoc Trends, are a custom type of trend that you can build right inside your Visual KPI site. You can save an Ad Hoc Trend, add it to the Dashboard, and update it in real-time.
Click anywhere in an individual KPI to enlarge the trend and get access to options for visualizing your trend based on the parameters you choose. Trends can monitor a value or show a current status if your administrator has configured targets and limits. The default trend view will depend on how your admin has configured trends. Still, you have many options for viewing Visual KPI trends and quickly seeing how a KPI performs over time.
You can do many different things with Trends to see data in various ways. When visualizing a trend, you have the following visualization options:
- Trend Options (): Choose Trend Scale and Line types, turn on/off Trend live updates, and define the Pen width.
- Modify Trend (): Select minimum and maximum for the Y axis, add pens, and customize your Trend.
- Raw Data (): Export data to CSV or view it in Visual KPI.
- Time Ranges (): Configure a start and end time for your Trend.
- Revert (): Return to the default KPI view.
- View Details (): See more details of the KPI, such as Contacts, Links, KPI properties, KPI stats, and Parameters.
- View as Gauge (): View KPI as a Gauge Chart.
- View as Histogram: View KPI as a Histogram Chart.
- Status Background (): Turn on/off the background to see the historical status changes of a trend in full color.
- Box Zoom Mode (): Select an area to zoom in.
- Drag Mode (): Click and drag to change the time view.
- Cursor Mode (): Scroll over the trend chart with your mouse to see more data details associated with specific points in time along the Trend. Clicking or tapping on the Trend will lock the current cursor and let you add additional cursors for comparison.
- Snap to (): Snap your cursor to point along the trend line where actual values exist in the data source, highlighting the difference between actual values and interpolated lines drawn between values.
- Comments (): Click the comments icon to view and add comments at specific times in the Trend. You can click a specific point or click and drag to select a time span. Comments can include pre-defined messages or customized ones. You can also reply to existing comments.
- Timestamp (/): Use paddles to change the time view.
- Legend: You can define the limits and references for your Trend and name each of those references as you like. These names will be shown on the legend.
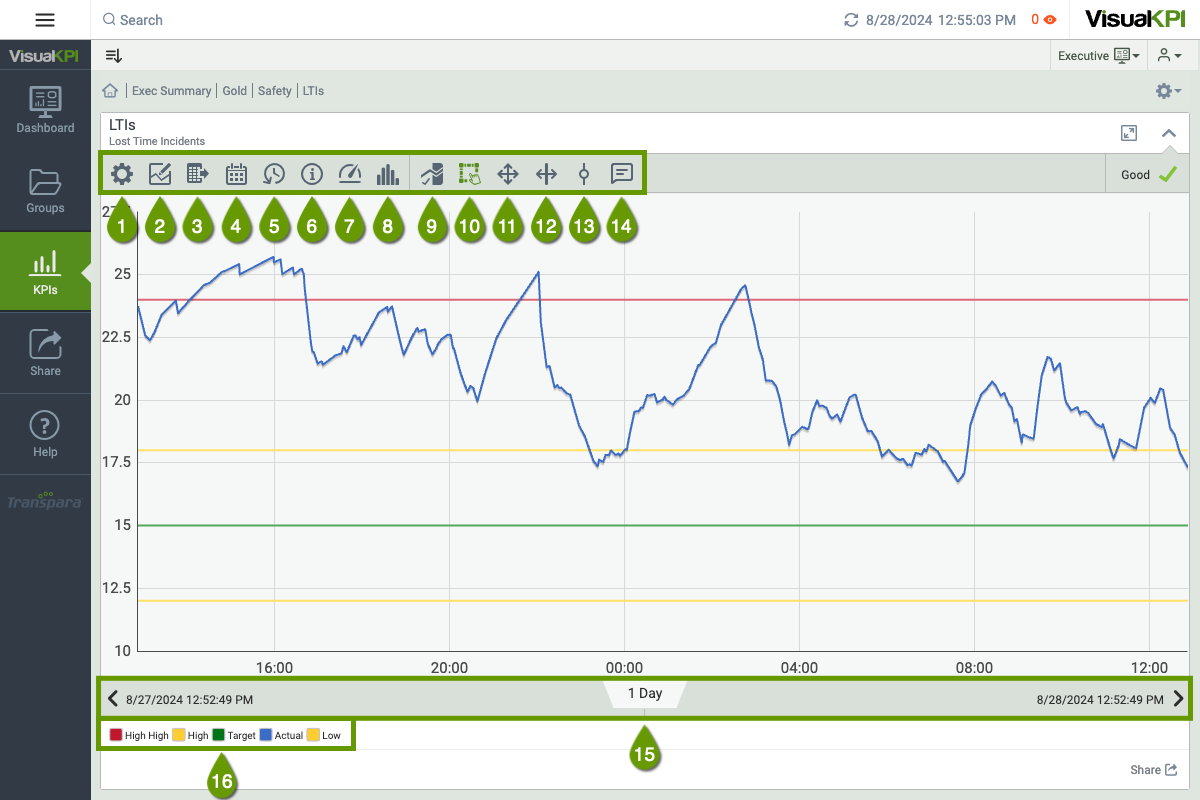
For a standard Visual KPI trend with targets and limits, you'll see a trend of the KPI value over time, along with targets and limits and the current status. A legend will appear below the trend to indicate how to read targets and limits. You can change everything from the time range view to the status history using the Trend menu. You can view raw data and details about the KPI.
The trend line is amplified when you hover over it or its legend name. This is especially useful when dealing with several pens on the same tread.
Trend view options
The Trend Options icon () lets you change how you view data, targets, and limits in a trend.
Trend scale
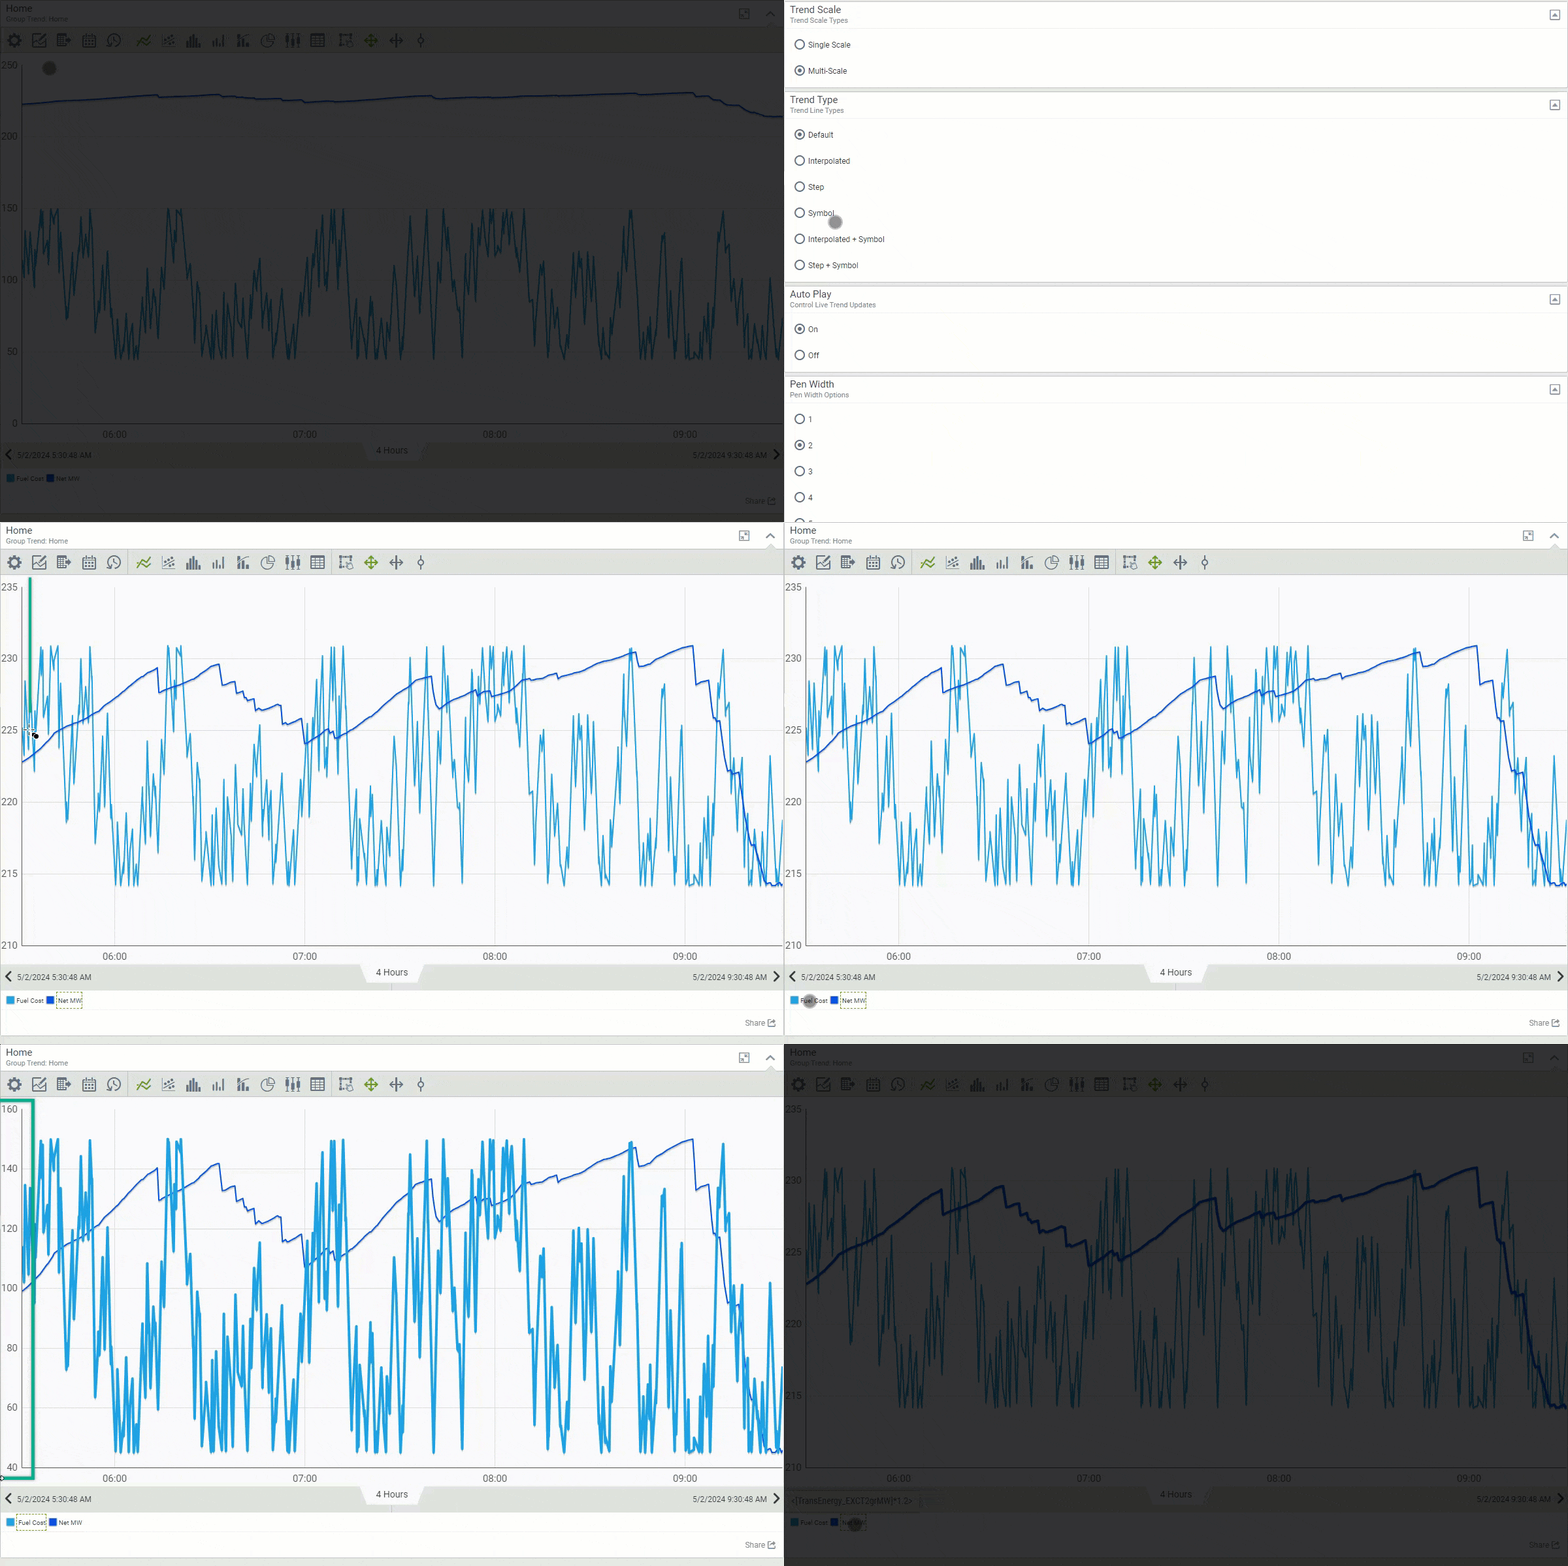
As you know, you can add several KPIs to the same trend. However, each trend may have completely different scales, making it harder to compare the KPIs or views in a single trend.
The trend scale feature enables you to use single or multi-scale in a Trend. The multi-scale option is most appropriate when viewing managed or Ad Hoc trends with multiple pens with very different scales. Clicking on the pen name in the trend legend when using multi-scale trends will adjust the Y-axis.
Trend Gestures
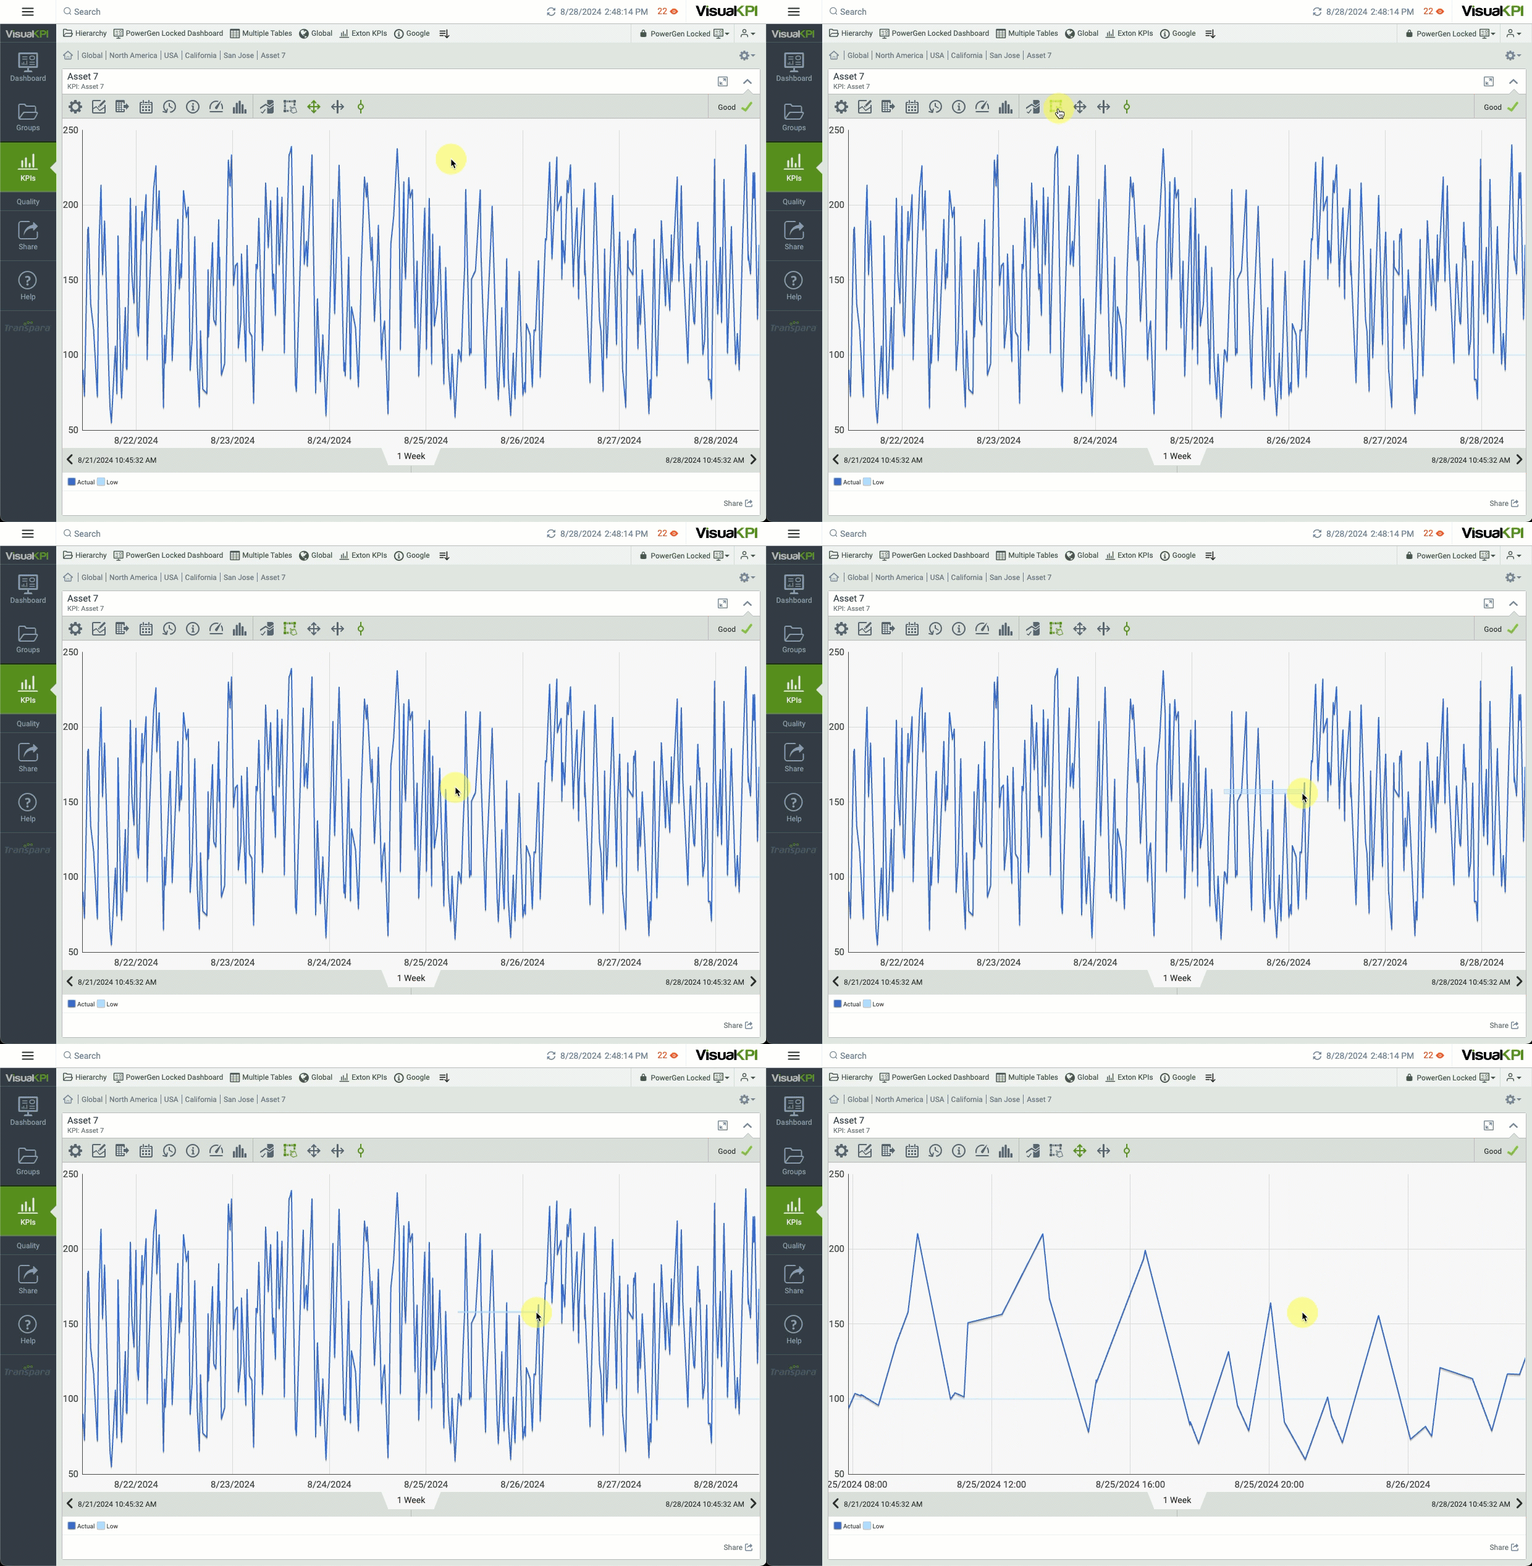
Trend Gestures in VisualKPI allow users to interact with trend charts more dynamically and in detail, enhancing the ability to analyze and interpret data visually. These gestures are primarily performed using a mouse or touch interface, depending on the device. The first gesture is the Mouse Wheel Zoom, where you can zoom in and out of the trend chart by scrolling the mouse wheel. The zoom is centered on the current position of the mouse pointer, allowing you to focus on specific areas of the trend. Additionally, holding down the Control key while scrolling will zoom only along the x-axis, while holding the Alt key will zoom along the y-axis. The Pinch-to-Zoom gesture offers similar functionality for touch devices like tablets, allowing users to zoom in and out using two fingers.
Another powerful feature is the Box Zoom. When drawing a large rectangle on the chart, the selected area zooms in, providing a closer view of the data. However, if you draw a horizontal line or narrow rectangle, the zoom will apply only to the selected time period, but with the ideal zoom to visualize everything in that period. These gestures, while more commonly used on desktop setups, can also be utilized on mobile devices, allowing users to interact precisely with Trends, even on the go.
Trend type
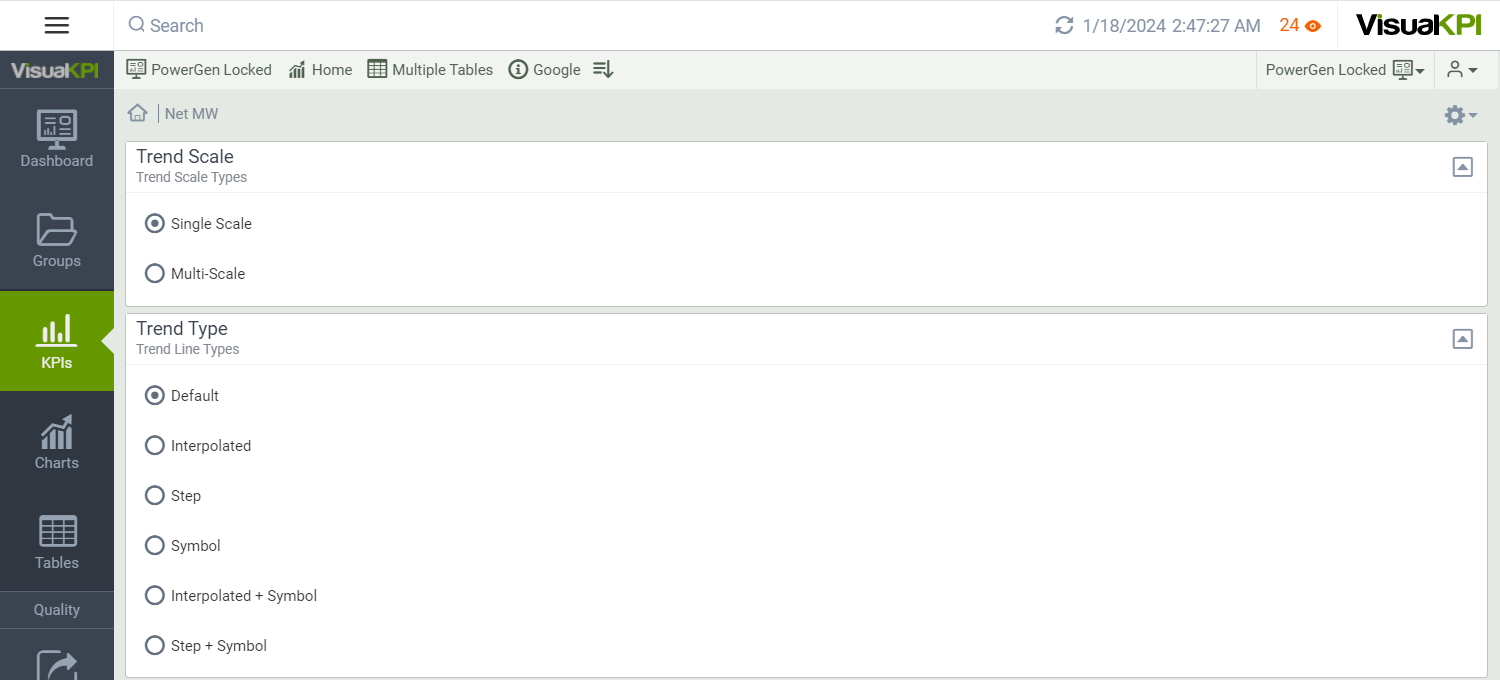
Change the Trend Type to view Interpolated, Step, Symbol, or a combination of views. The Default Trend Type is interpolated unless set by your admin in the Visual KPI Designer.
Trends in the KPI tab
In the KPI tab, use the Trend Options icon () to change how you view data, targets, and limits in a trend. When comparing KPIs, it is as easy as selecting them to create multi-KPI charts and trends. This feature allows you to select up to 20 KPIs and view them as a trend, bar chart, Pareto chart, or pie chart.
From any KPI list view, click the Select KPI icon () and select multiple KPIs by clicking the box to the left of the KPIs in the list. From the sub-menu, select the trend icon or type of chart you wish to view.
- Trend
- Bar chart
- Pareto chart
- Pie chart
- Box plot
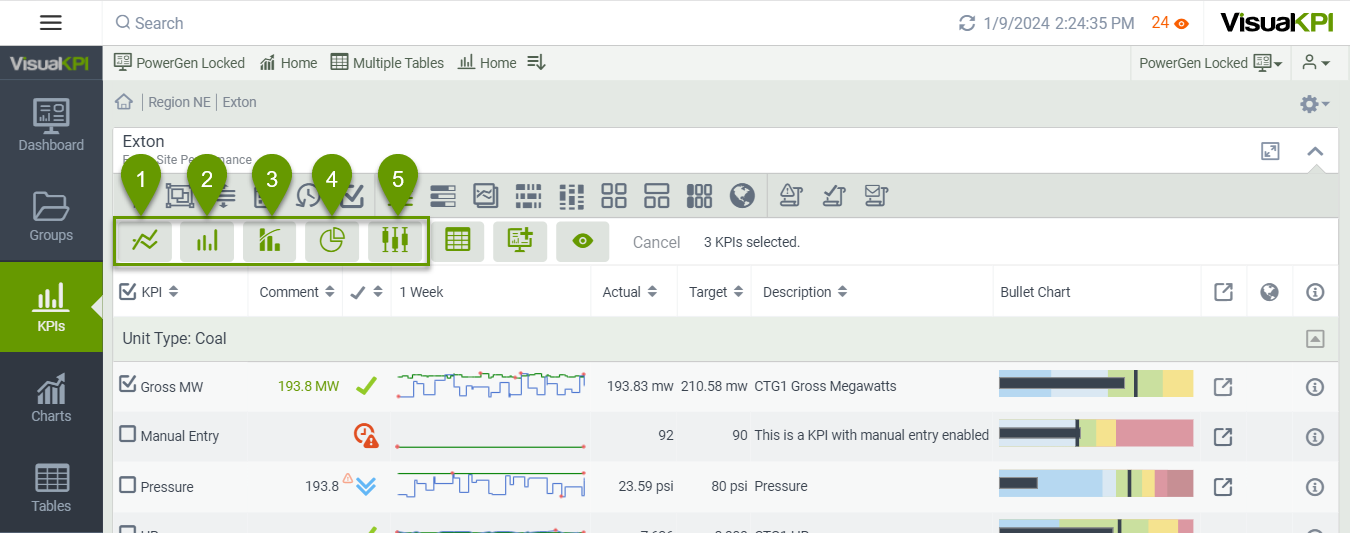
Regardless of the trend or chart type you selected to view, you can use the menu in the new view to choose any of the other trends or chart types to visualize data in. When in a trend, you can add a background color to show status changes over time using the Show Status Background icon.
What's next?
To finish your learning, check out the Embedded Content for more information on using external links in Visual KPI or embedding Visual KPI in other applications.