Analytics
Visual KPI provides different types of analytics you can configure and use to understand KPI patterns. In addition, on this page, you find how you can pivot your data from different angles to get a complete view of how your operations are running.
Ad Hoc Trend View
The Ad Hoc Trend view, or simply Ad Hoc Trend, is a custom type of trend that you can build right inside your Visual KPI. For a standard Visual KPI trend with targets and limits, you'll see a trend of the KPI value over time, along with targets and limits and the current status. A legend will appear below the trend to help you read targets and limits.
Like all Visual KPI objects, Ad Hoc Trends updates in near real-time. Each definition you create in the trend is called a “pen.” The Visual KPI Server retrieves or calculates the values associated with each pen definition based on the time range specified for the Ad Hoc Trend. The default trend view will depend on how your admin has configured trends. Here are some features of an Ad Hoc Trend:
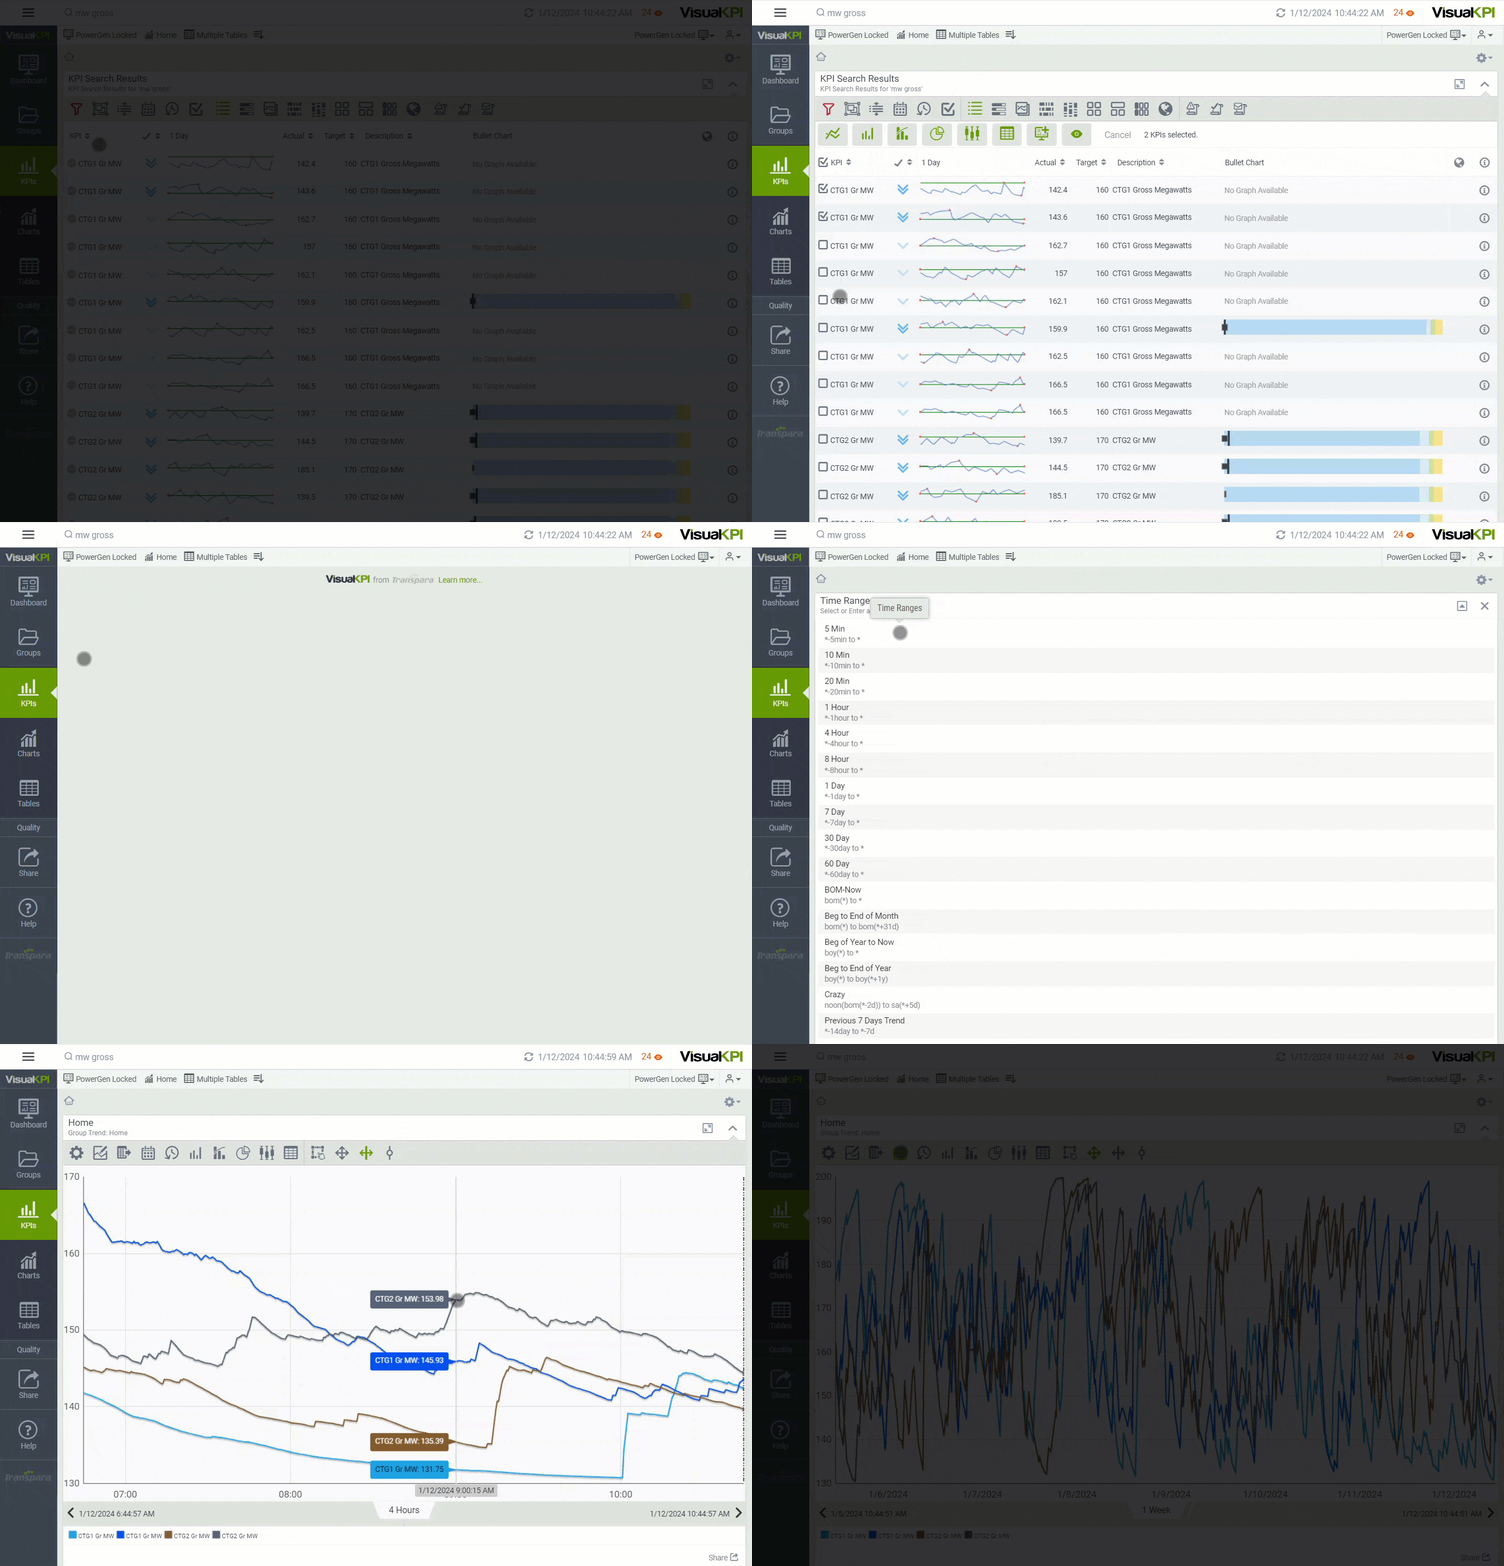
- Create an Ad Hoc Trend from any KPI List View.
- Use up to 20 pens per trend.
- When viewing an existing trend and selecting Ad Hoc Trend, you start with the existing pens, and then you can edit and add more.
- Support for future data for forecasting and predictive analytics.
- Get the full array of trending tools, like inside any Visual KPI trend.

Building Ad Hoc Trends
You can build an Ad Hoc Trend from scratch or make it based on an existing KPI.
To build an Ad Hoc Trend from scratch, follow the steps below:
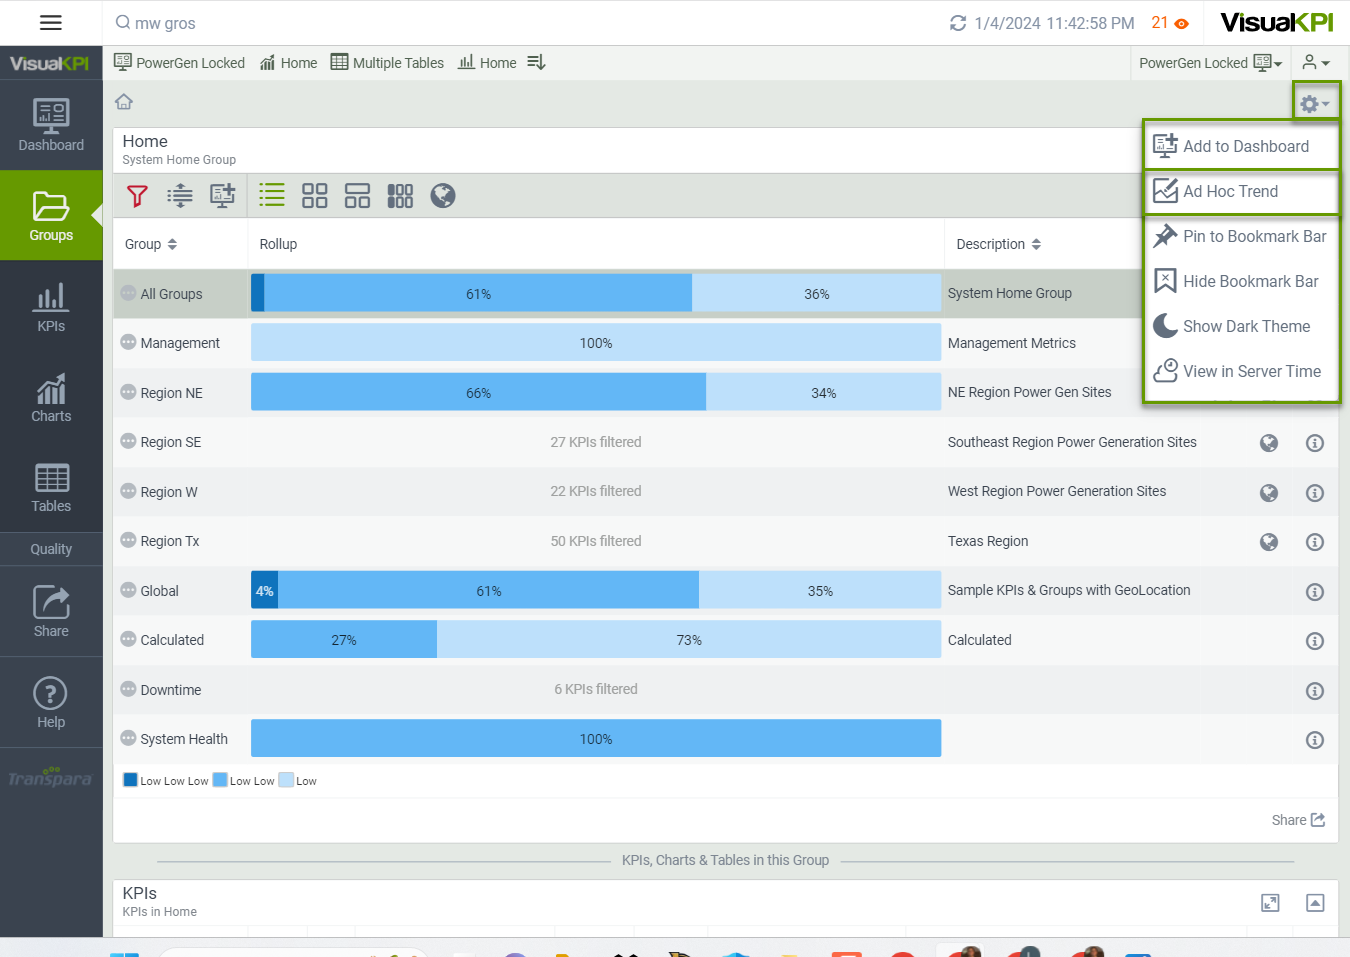
- Click Options() on the top right.
- Select Ad Hoc Trend.
To build an Ad Hoc Trend based on an existing KPI, follow the steps below:
- Open the KPI.
- Click Options() on the top right.
- Select Ad Hoc Trend.

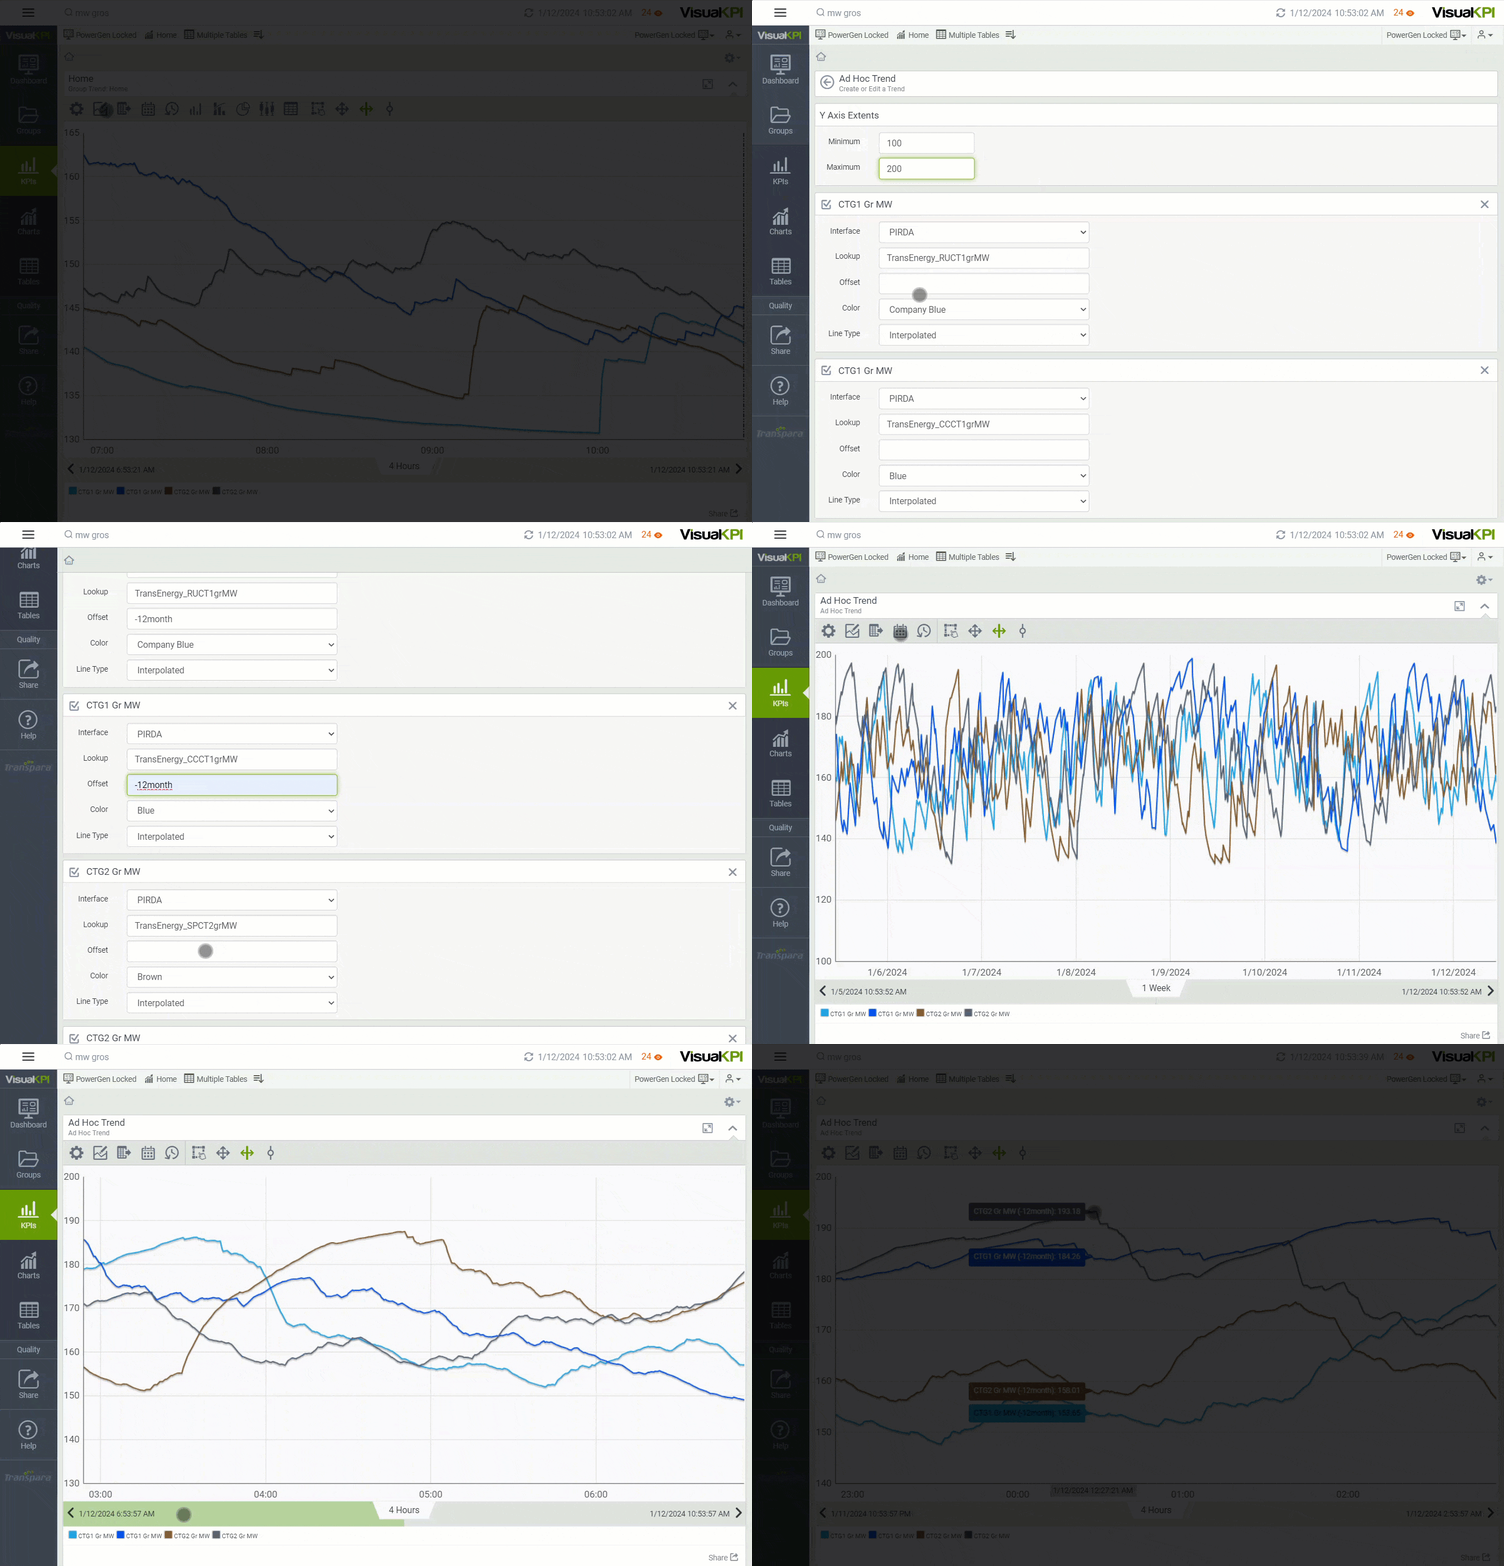
When building an Ad Hoc Trend, you'll define KPI attributes by adding pens. Enter the values for Actual and at least one other KPI attribute. The Ad Hoc Trend will be added to your Dashboard.
- To specify the Trend's scale, enter values for the Y-Axis.
- Select an Interface and add a Lookup value. The list includes all interfaces defined for the current Visual KPI Server. Or, you can select Constant Value.
- Add an Offset value (optional).
- Select the pen color. You can use a different color for each attribute.
- Select the type of line you want the Trend to display.
- To add more attributes to the Ad Hoc Trend, click Add Pen and enter the values.
- Once you have added all attributes to your Ad Hoc Trend, click Trend.
You can use an Offset when creating an Ad Hoc Trend, allowing you to compare trends using different start dates and times.
For example, you can create the Trend by defining pens and assigning an Offset of “-12month” to one or more pens. Then, set a custom time range once the Ad Hoc trend is drawn. Use the cursor to click on the Trend and see their values.
When defining an Offset, use the following notation:
[+/-][integer][timeperiod], where [timeperiod] is a member of the following set: minute, hour, h, day, d, month, year.

Select the check box associated with the pen if you want the attribute displayed on the Ad Hoc Trend. Remove the check mark if you want to keep the attribute available for future use in the Ad Hoc Trend but don't want it displayed now.
You can also access our Visual KPI End-User Training course and watch the Analytics class.
What's Next?
Learn about Alerts and how to get the most out of them.