Time
This section will present how End Users can work with different time parameters in Visual KPI. You will learn how to change the time reference for your timestamp and the Time Range Picker for data visualization.
Timestamp
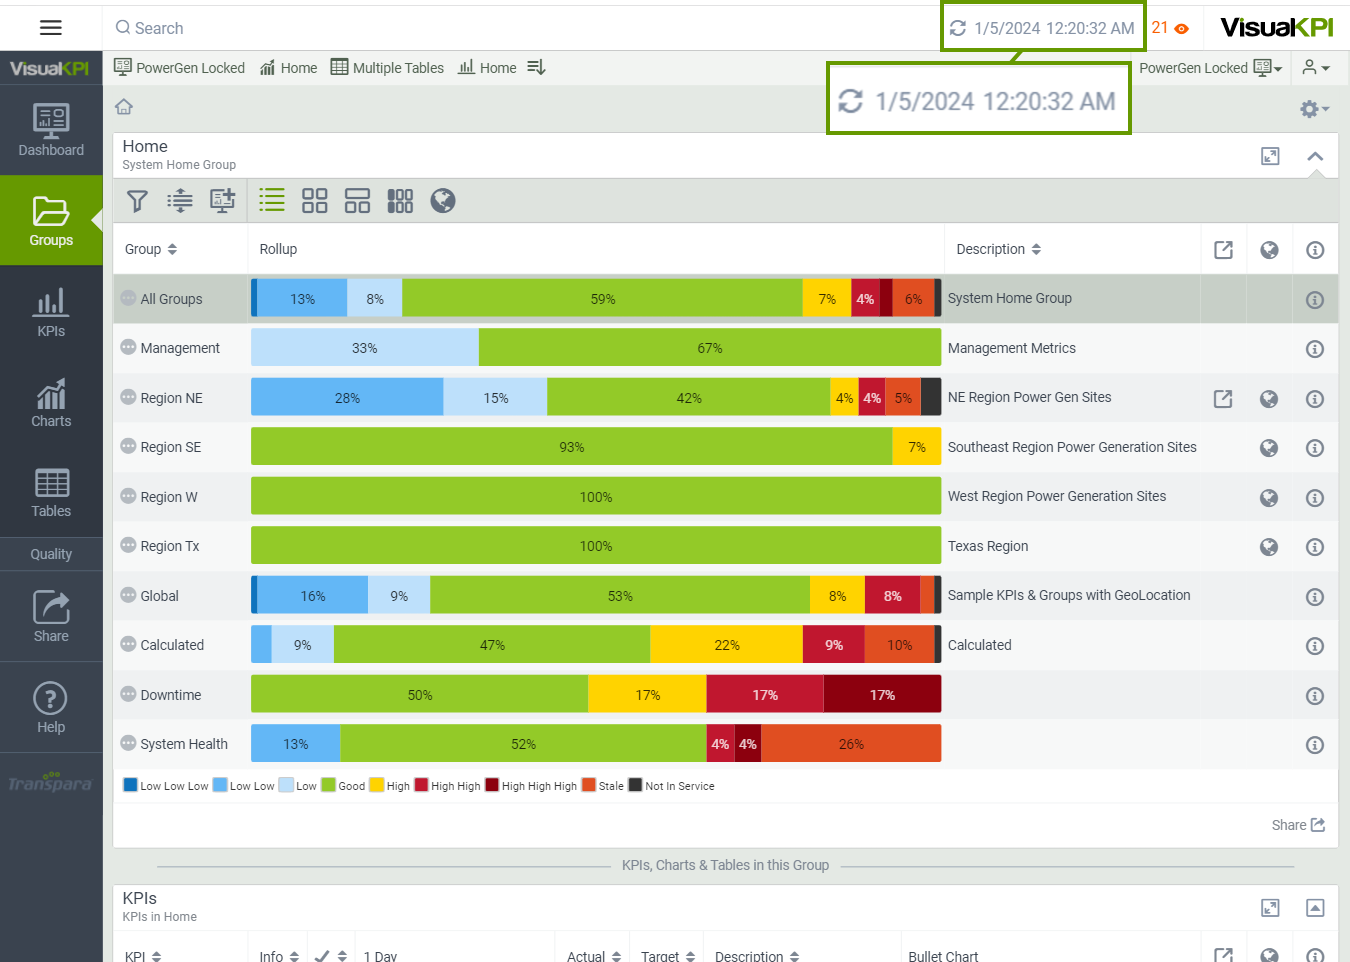
Visual KPI shows your data in near real-time. By default, the timestamp display in Visual KPI sites is set to Client Time, the time indicated by the device on which you access the Visual KPI client. Your admin can set the default to Client Time or Server Time and decide whether or not users can change the timestamp display setting in the client.
The timestamp display in the top bar of Visual KPI sites shows you the exact time, down to the second, that the server returned the currently viewed data. If you have admin permission, you can display the timestamp based on the server or client time, even if the server and Visual KPI client are in different time zones.

Relative Time Functions
You don't have to select data for a specific time in Visual KPI or adjust the time parameters of a visualization (for example, trend, XY plot, etc.) in your Visual KPI site to change the range of data shown. Typically, time functions are used to create charts and trend ranges. When viewing data, you can use a time function to tell Visual KPI a specific, or static, date and time to start and end. You can use relative time, such as telling Visual KPI to pull a trend that starts at midnight "yesterday," with "yesterday" as a time relative to when you ask for the data.
Offset Time Functions
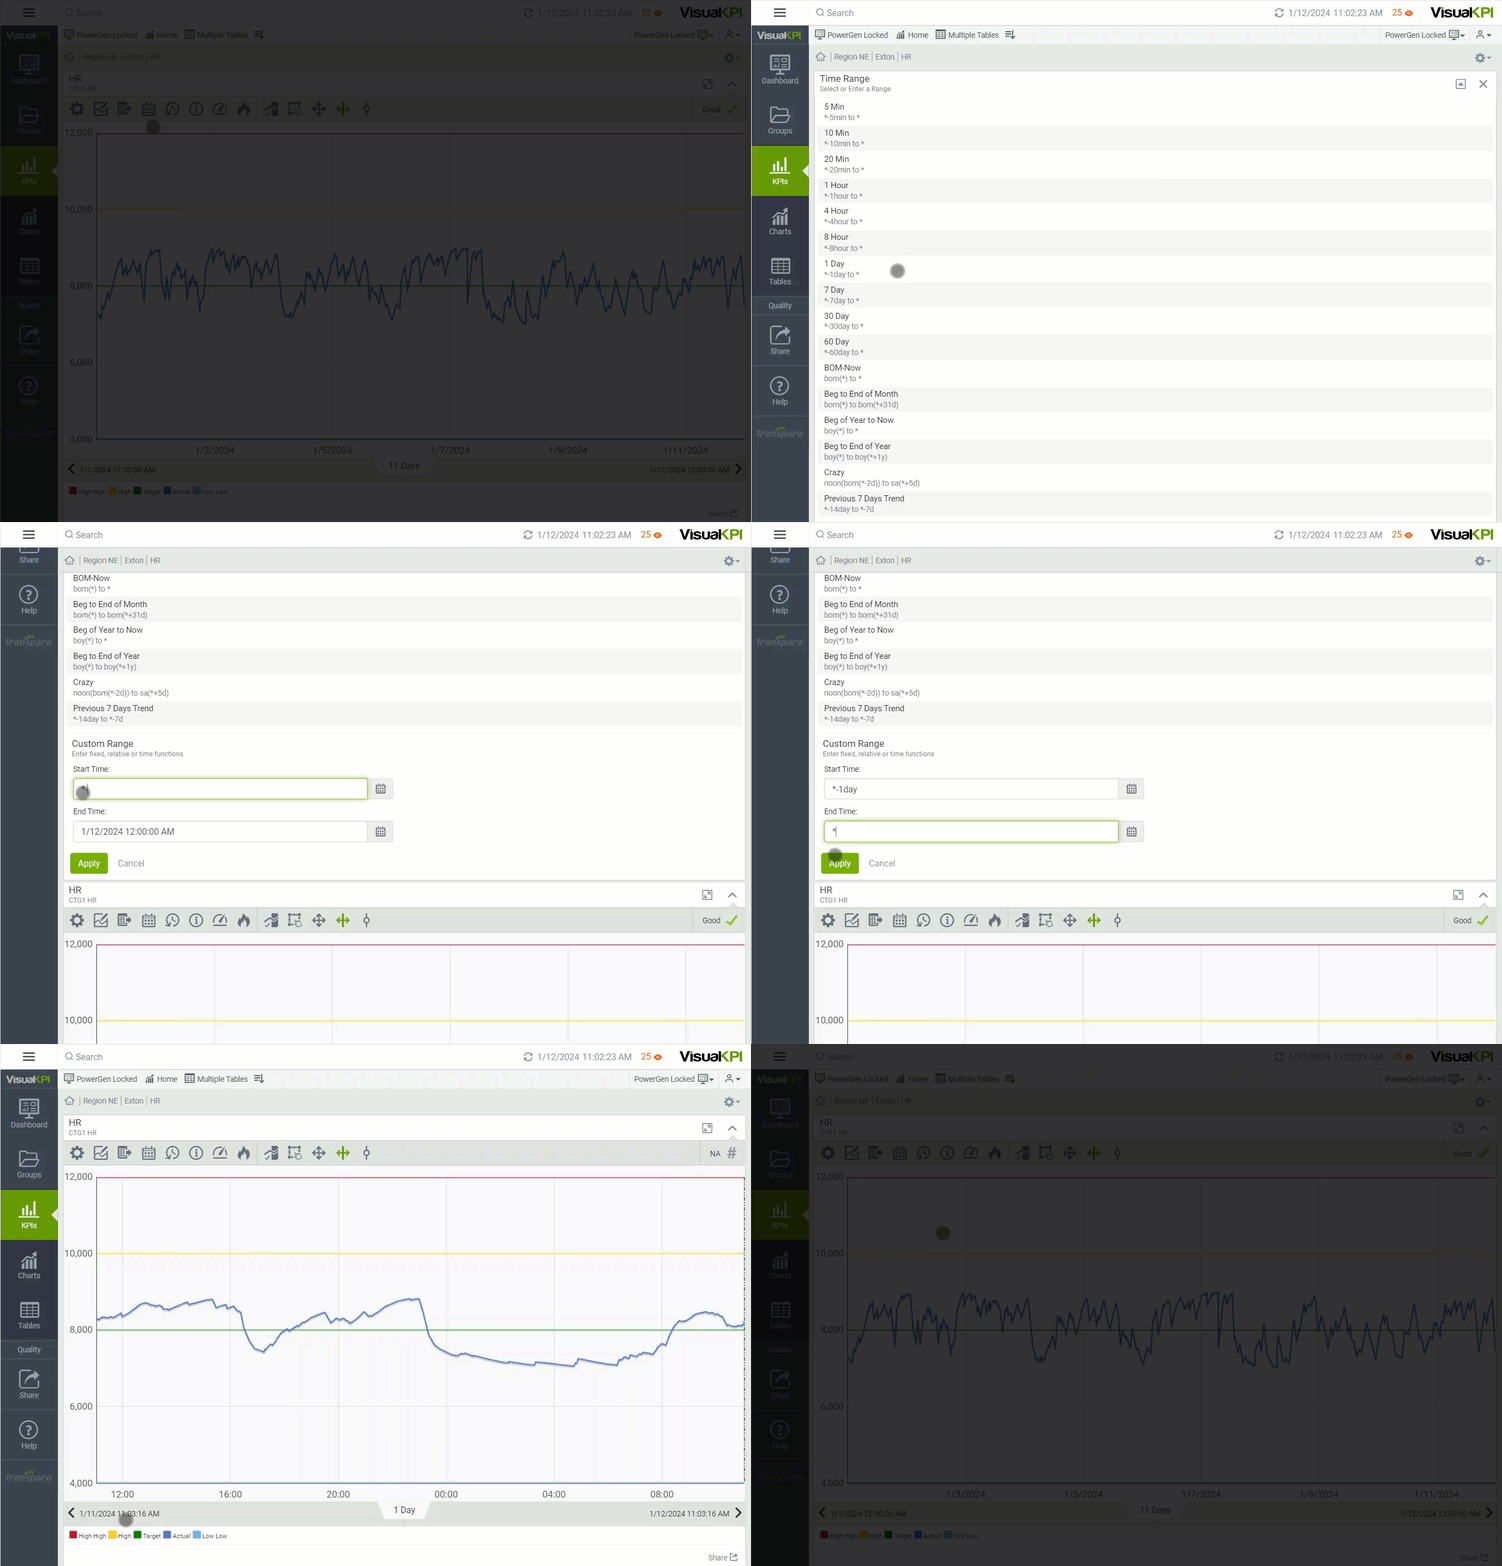
You can use offset time, meaning you call data based on a specific time plus or minus another time function. Let's say you want to know the volume of goods manufactured "in the last 24 hours" right now. You could use the relative of "now" (represented by the '*' symbol) minus (-) 1 day. The function would look like this: *-1day.

Combining Time Functions
Visual KPI's relative time functions are about more than just complexity. They are about practicality. By using the asterisk symbol for "now" (*) as your end time, the right edge of your trends will always display the most recent value available from your data source for that item. Similarly, if you use the function "y" as your end time, the right edge of your trend will show the most recent value before midnight yesterday. This applies to start times as well.
You can also combine functions to get something crazy (or powerful, if you prefer), like a start time defined as "go back 12 days, then show the beginning of whatever month that is, and then show what the value was at noon on that day." Using relative time functions in Visual KPI, represented as noon(bom(*-2d)).
Here are some examples of how you can combine relative time functions:
- Beginning of this month = bom(*)
- Beginning of next month = bom(*+1mo)
- Start of this year = boy(*)
- Start of last year = boy(*-1y)
- Start of next year = boy(*+1y)
- Noon of the most recent Saturday = noon(Sa(*))
- Noon of the beginning of last year = noon(boy(*-1y))
- Noon of the Saturday prior to 46 weeks ago: noon(sa(*-46w))